|
Download Data (XLS File) |
|
||||||||
|
||||||||
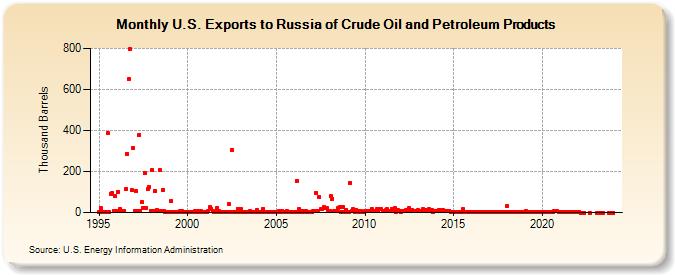
| U.S. Exports to Russia of Crude Oil and Petroleum Products (Thousand Barrels) | ||||||||
| Year | Jan | Feb | Mar | Apr | May | Jun | Jul | Aug | Sep | Oct | Nov | Dec |
|---|---|---|---|---|---|---|---|---|---|---|---|---|
| 1995 | 1 | 21 | 3 | 2 | 1 | 4 | 386 | 3 | 91 | 95 | 9 | 81 |
| 1996 | 7 | 101 | 18 | 8 | 8 | 8 | 114 | 287 | 650 | 797 | 109 | 316 |
| 1997 | 8 | 104 | 8 | 379 | 8 | 50 | 24 | 194 | 21 | 114 | 124 | 10 |
| 1998 | 206 | 9 | 104 | 12 | 9 | 206 | 8 | 109 | 7 | 4 | 3 | 5 |
| 1999 | 3 | 57 | 3 | 4 | 2 | 2 | 5 | 9 | 8 | 1 | 1 | 2 |
| 2000 | 3 | 2 | 1 | 1 | 2 | 6 | 2 | 6 | 1 | 7 | 2 | 2 |
| 2001 | 2 | 3 | 6 | 25 | 19 | 9 | 4 | 1 | 22 | 8 | 4 | 1 |
| 2002 | 3 | 1 | 2 | 2 | 40 | 2 | 306 | 2 | 3 | 3 | 18 | 2 |
| 2003 | 15 | 2 | 3 | 1 | 2 | 2 | 6 | 4 | 5 | 4 | 3 | 11 |
| 2004 | 4 | 4 | 5 | 19 | 5 | 2 | 3 | 2 | 3 | 4 | 3 | 3 |
| 2005 | 3 | 3 | 6 | 4 | 9 | 3 | 2 | 8 | 4 | 2 | 3 | 4 |
| 2006 | 5 | 3 | 156 | 15 | 5 | 6 | 3 | 6 | 6 | 4 | 4 | 4 |
| 2007 | 5 | 6 | 8 | 97 | 8 | 76 | 15 | 17 | 27 | 23 | 20 | 9 |
| 2008 | 7 | 79 | 68 | 8 | 7 | 7 | 20 | 29 | 4 | 26 | 4 | 14 |
| 2009 | 4 | 4 | 145 | 6 | 15 | 4 | 14 | 6 | 4 | 6 | 4 | 5 |
| 2010 | 6 | 7 | 9 | 6 | 6 | 16 | 8 | 7 | 15 | 9 | 15 | 15 |
| 2011 | 10 | 7 | 12 | 16 | 8 | 10 | 18 | 8 | 20 | 5 | 13 | 9 |
| 2012 | 5 | 7 | 7 | 9 | 12 | 13 | 20 | 10 | 12 | 7 | 7 | 8 |
| 2013 | 11 | 10 | 10 | 15 | 13 | 11 | 12 | 15 | 9 | 11 | 4 | 8 |
| 2014 | 7 | 9 | 14 | 10 | 11 | 11 | 9 | 10 | 9 | 10 | 4 | 2 |
| 2015 | 2 | 4 | 4 | 5 | 2 | 3 | 15 | 4 | 4 | 3 | 2 | 2 |
| 2016 | 1 | 2 | 2 | 3 | 4 | 3 | 4 | 2 | 4 | 3 | 3 | 3 |
| 2017 | 4 | 3 | 5 | 4 | 3 | 4 | 4 | 3 | 2 | 3 | 4 | 2 |
| 2018 | 30 | 3 | 4 | 4 | 3 | 4 | 5 | 4 | 3 | 3 | 3 | 3 |
| 2019 | 5 | 8 | 2 | 4 | 4 | 3 | 4 | 2 | 3 | 3 | 2 | 2 |
| 2020 | 5 | 5 | 3 | 2 | 5 | 3 | 4 | 5 | 9 | 6 | 6 | 3 |
| 2021 | 2 | 4 | 4 | 3 | 3 | 3 | 3 | 1 | 2 | 3 | 3 | 2 |
| 2022 | 3 | 4 | 0 | 0 | 0 | 0 | ||||||
| 2023 | 0 | 0 | 0 | 0 | 0 | |||||||
| 2024 | 0 | |||||||||||
| - = No Data Reported; -- = Not Applicable; NA = Not Available; W = Withheld to avoid disclosure of individual company data. |
| Release Date: 3/29/2024 |
| Next Release Date: 4/30/2024 |