|
Download Data (XLS File) |
|
||||||||
|
||||||||
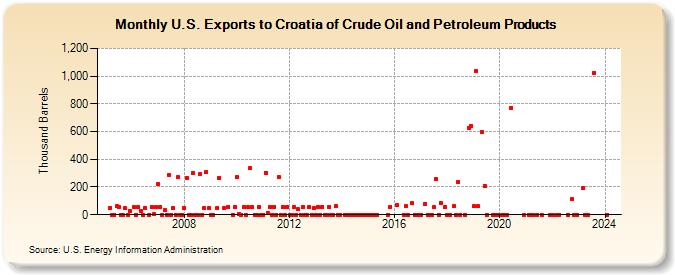
| U.S. Exports to Croatia of Crude Oil and Petroleum Products (Thousand Barrels) | ||||||||
| Year | Jan | Feb | Mar | Apr | May | Jun | Jul | Aug | Sep | Oct | Nov | Dec |
|---|---|---|---|---|---|---|---|---|---|---|---|---|
| 2005 | 52 | 0 | 0 | 61 | 59 | 1 | 0 | 46 | 0 | 29 | ||
| 2006 | 54 | 1 | 54 | 30 | 0 | 51 | 0 | 55 | 3 | 54 | ||
| 2007 | 223 | 54 | 0 | 31 | 0 | 290 | 0 | 46 | 1 | 270 | 0 | 0 |
| 2008 | 48 | 267 | 1 | 0 | 301 | 1 | 1 | 295 | 1 | 45 | 307 | 47 |
| 2009 | 1 | 0 | 50 | 268 | 50 | 58 | 0 | 54 | ||||
| 2010 | 272 | 2 | 1 | 55 | 1 | 54 | 337 | 54 | 0 | 1 | 57 | 0 |
| 2011 | 0 | 304 | 15 | 59 | 1 | 58 | 0 | 273 | 0 | 57 | 0 | 54 |
| 2012 | 0 | 1 | 55 | 1 | 39 | 1 | 57 | 1 | 0 | 57 | 0 | 45 |
| 2013 | 0 | 58 | 0 | 58 | 1 | 0 | 58 | 0 | 0 | 61 | 0 | 0 |
| 2014 | 0 | 0 | 0 | 0 | 0 | 0 | 0 | 0 | 0 | 0 | 0 | |
| 2015 | 0 | 0 | 0 | 0 | 0 | 0 | 58 | |||||
| 2016 | 67 | 0 | 61 | 0 | 82 | 0 | 0 | 0 | ||||
| 2017 | 0 | 79 | 0 | 0 | 0 | 55 | 258 | 0 | 83 | 55 | ||
| 2018 | 0 | 0 | 61 | 0 | 237 | 0 | 0 | 625 | 643 | |||
| 2019 | 61 | 1,034 | 61 | 600 | 210 | 0 | 0 | 0 | 0 | |||
| 2020 | 0 | 0 | 0 | 770 | 0 | |||||||
| 2021 | 0 | 0 | 0 | 0 | 0 | 0 | ||||||
| 2022 | 0 | 0 | 0 | 0 | 110 | 0 | 0 | |||||
| 2023 | 193 | 0 | 0 | 1,026 | ||||||||
| - = No Data Reported; -- = Not Applicable; NA = Not Available; W = Withheld to avoid disclosure of individual company data. |
| Release Date: 3/29/2024 |
| Next Release Date: 4/30/2024 |