|
Download Data (XLS File) |
|
||||||||
|
||||||||
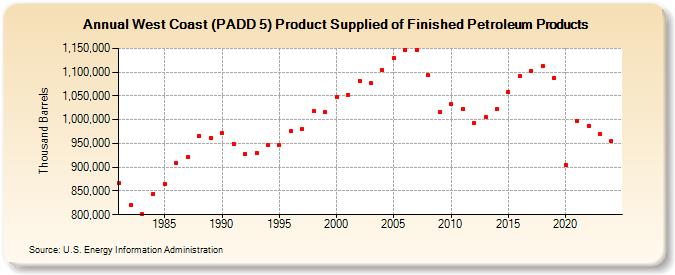
| West Coast (PADD 5) Product Supplied of Finished Petroleum Products (Thousand Barrels) | ||||||||
| Decade | Year-0 | Year-1 | Year-2 | Year-3 | Year-4 | Year-5 | Year-6 | Year-7 | Year-8 | Year-9 |
|---|---|---|---|---|---|---|---|---|---|---|
| 1980's | 866,390 | 819,424 | 800,983 | 844,328 | 864,633 | 908,438 | 920,472 | 966,536 | 962,149 | |
| 1990's | 971,323 | 949,352 | 928,573 | 930,382 | 946,783 | 946,285 | 976,101 | 980,551 | 1,017,894 | 1,015,304 |
| 2000's | 1,046,923 | 1,052,250 | 1,082,000 | 1,076,557 | 1,104,371 | 1,128,735 | 1,147,394 | 1,147,256 | 1,093,219 | 1,015,265 |
| 2010's | 1,032,733 | 1,021,724 | 993,857 | 1,004,934 | 1,022,505 | 1,058,857 | 1,091,772 | 1,102,791 | 1,111,994 | 1,088,340 |
| 2020's | 904,383 | 996,711 | 987,495 | 971,059 |
| - = No Data Reported; -- = Not Applicable; NA = Not Available; W = Withheld to avoid disclosure of individual company data. |
| Release Date: 3/29/2024 |
| Next Release Date: 8/30/2024 |