|
Download Data (XLS File) |
|
||||||||
|
||||||||
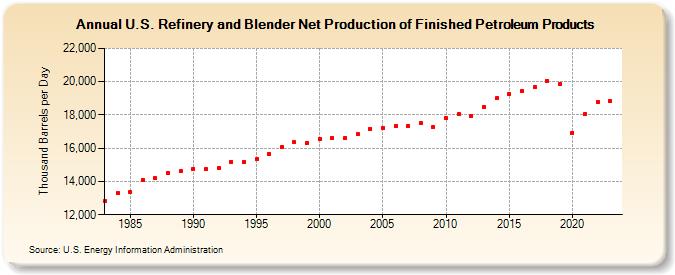
| U.S. Refinery and Blender Net Production of Finished Petroleum Products (Thousand Barrels per Day) | ||||||||
| Decade | Year-0 | Year-1 | Year-2 | Year-3 | Year-4 | Year-5 | Year-6 | Year-7 | Year-8 | Year-9 |
|---|---|---|---|---|---|---|---|---|---|---|
| 1980's | 12,810 | 13,316 | 13,359 | 14,105 | 14,178 | 14,523 | 14,620 | |||
| 1990's | 14,773 | 14,720 | 14,791 | 15,195 | 15,179 | 15,340 | 15,662 | 16,068 | 16,356 | 16,306 |
| 2000's | 16,538 | 16,618 | 16,602 | 16,829 | 17,169 | 17,227 | 17,348 | 17,340 | 17,516 | 17,259 |
| 2010's | 17,793 | 18,054 | 17,934 | 18,483 | 19,001 | 19,271 | 19,447 | 19,670 | 20,059 | 19,834 |
| 2020's | 16,943 | 18,045 | 18,785 | 18,835 |
| - = No Data Reported; -- = Not Applicable; NA = Not Available; W = Withheld to avoid disclosure of individual company data. |
| Release Date: 3/29/2024 |
| Next Release Date: 8/30/2024 |