|
Download Data (XLS File) |
|
||||||||
|
||||||||
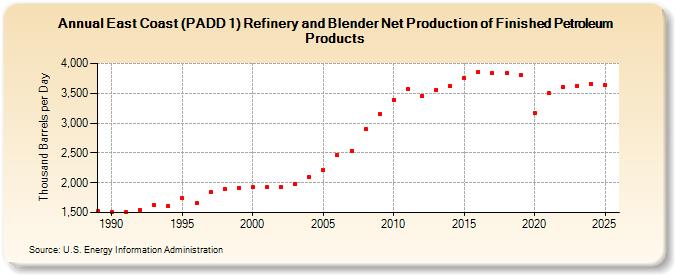
| East Coast (PADD 1) Refinery and Blender Net Production of Finished Petroleum Products (Thousand Barrels per Day) | ||||||||
| Decade | Year-0 | Year-1 | Year-2 | Year-3 | Year-4 | Year-5 | Year-6 | Year-7 | Year-8 | Year-9 |
|---|---|---|---|---|---|---|---|---|---|---|
| 1980's | 1,522 | |||||||||
| 1990's | 1,504 | 1,508 | 1,540 | 1,625 | 1,605 | 1,739 | 1,657 | 1,839 | 1,897 | 1,919 |
| 2000's | 1,926 | 1,922 | 1,929 | 1,984 | 2,093 | 2,218 | 2,459 | 2,538 | 2,901 | 3,146 |
| 2010's | 3,395 | 3,566 | 3,459 | 3,552 | 3,619 | 3,760 | 3,863 | 3,840 | 3,833 | 3,806 |
| 2020's | 3,169 | 3,499 | 3,607 | 3,627 |
| - = No Data Reported; -- = Not Applicable; NA = Not Available; W = Withheld to avoid disclosure of individual company data. |
| Release Date: 3/29/2024 |
| Next Release Date: 8/30/2024 |