|
Download Data (XLS File) |
|
||||||||
|
||||||||
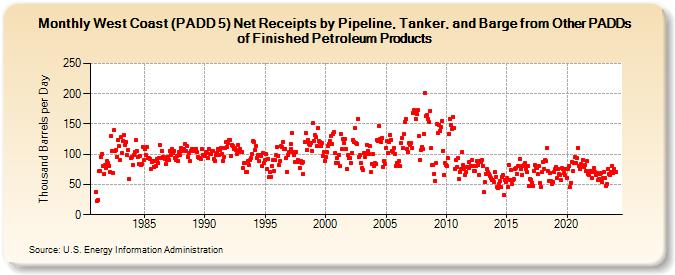
| West Coast (PADD 5) Net Receipts by Pipeline, Tanker, and Barge from Other PADDs of Finished Petroleum Products (Thousand Barrels per Day) | ||||||||
| Year | Jan | Feb | Mar | Apr | May | Jun | Jul | Aug | Sep | Oct | Nov | Dec |
|---|---|---|---|---|---|---|---|---|---|---|---|---|
| 1981 | 38 | 22 | 24 | 72 | 73 | 96 | 101 | 81 | 68 | 83 | 78 | 88 |
| 1982 | 85 | 81 | 71 | 130 | 105 | 69 | 140 | 106 | 107 | 96 | 123 | 113 |
| 1983 | 91 | 129 | 102 | 122 | 131 | 116 | 120 | 98 | 107 | 59 | 94 | 95 |
| 1984 | 83 | 99 | 103 | 123 | 106 | 95 | 84 | 97 | 83 | 84 | 112 | 90 |
| 1985 | 108 | 99 | 112 | 94 | 93 | 92 | 75 | 87 | 88 | 79 | 88 | 80 |
| 1986 | 92 | 86 | 94 | 116 | 93 | 106 | 96 | 95 | 92 | 84 | 90 | 96 |
| 1987 | 90 | 105 | 99 | 109 | 102 | 105 | 93 | 90 | 97 | 89 | 103 | 98 |
| 1988 | 110 | 106 | 107 | 109 | 117 | 106 | 113 | 96 | 102 | 88 | 106 | 109 |
| 1989 | 105 | 107 | 109 | 109 | 104 | 96 | 93 | 94 | 92 | 108 | 99 | 99 |
| 1990 | 97 | 103 | 102 | 93 | 108 | 101 | 101 | 105 | 105 | 92 | 88 | 98 |
| 1991 | 102 | 109 | 98 | 107 | 110 | 100 | 89 | 96 | 110 | 120 | 112 | 118 |
| 1992 | 124 | 124 | 97 | 116 | 114 | 108 | 110 | 107 | 100 | 115 | 103 | 109 |
| 1993 | 103 | 104 | 77 | 85 | 85 | 70 | 71 | 88 | 82 | 90 | 94 | 100 |
| 1994 | 122 | 121 | 107 | 114 | 93 | 98 | 88 | 98 | 97 | 81 | 102 | 85 |
| 1995 | 90 | 100 | 76 | 92 | 62 | 70 | 63 | 81 | 91 | 73 | 91 | 98 |
| 1996 | 112 | 97 | 83 | 89 | 113 | 112 | 121 | 108 | 109 | 94 | 71 | 98 |
| 1997 | 104 | 117 | 109 | 135 | 103 | 99 | 87 | 104 | 91 | 87 | 78 | 88 |
| 1998 | 85 | 87 | 68 | 120 | 135 | 107 | 124 | 117 | 116 | 119 | 106 | 151 |
| 1999 | 122 | 131 | 128 | 114 | 143 | 122 | 121 | 114 | 118 | 97 | 103 | 89 |
| 2000 | 96 | 103 | 114 | 117 | 122 | 130 | 117 | 134 | 136 | 102 | 86 | 93 |
| 2001 | 85 | 99 | 80 | 133 | 109 | 125 | 119 | 125 | 109 | 76 | 98 | 93 |
| 2002 | 93 | 86 | 102 | 123 | 120 | 144 | 119 | 117 | 159 | 96 | 98 | 85 |
| 2003 | 77 | 74 | 102 | 96 | 102 | 116 | 105 | 100 | 113 | 70 | 84 | 100 |
| 2004 | 81 | 85 | 84 | 123 | 122 | 146 | 125 | 121 | 127 | 79 | 89 | 84 |
| 2005 | 111 | 122 | 102 | 120 | 132 | 124 | 106 | 104 | 111 | 101 | 81 | 85 |
| 2006 | 82 | 88 | 80 | 119 | 126 | 110 | 133 | 154 | 158 | 108 | 103 | 118 |
| 2007 | 115 | 119 | 111 | 168 | 173 | 170 | 158 | 166 | 173 | 130 | 91 | 107 |
| 2008 | 112 | 108 | 134 | 201 | 164 | 165 | 158 | 153 | 172 | 110 | 83 | 82 |
| 2009 | 68 | 56 | 85 | 150 | 135 | 149 | 139 | 145 | 155 | 106 | 66 | 86 |
| 2010 | 83 | 80 | 93 | 134 | 158 | 149 | 142 | 162 | 143 | 75 | 91 | 79 |
| 2011 | 94 | 59 | 71 | 76 | 104 | 82 | 76 | 66 | 71 | 79 | 87 | 77 |
| 2012 | 81 | 90 | 80 | 72 | 72 | 81 | 88 | 83 | 66 | 88 | 87 | 90 |
| 2013 | 81 | 37 | 54 | 67 | 75 | 71 | 67 | 64 | 60 | 57 | 58 | 54 |
| 2014 | 70 | 63 | 46 | 44 | 51 | 56 | 46 | 63 | 65 | 32 | 58 | 54 |
| 2015 | 60 | 45 | 83 | 58 | 74 | 50 | 57 | 59 | 76 | 77 | 68 | 80 |
| 2016 | 81 | 92 | 75 | 66 | 81 | 82 | 85 | 76 | 71 | 81 | 47 | 59 |
| 2017 | 58 | 53 | 47 | 73 | 82 | 78 | 77 | 67 | 80 | 52 | 46 | 70 |
| 2018 | 87 | 76 | 91 | 89 | 110 | 73 | 55 | 69 | 55 | 51 | 54 | 70 |
| 2019 | 75 | 79 | 60 | 76 | 67 | 66 | 57 | 77 | 75 | 69 | 65 | 76 |
| 2020 | 61 | 75 | 80 | 45 | 53 | 87 | 72 | 85 | 95 | 85 | 93 | 111 |
| 2021 | 80 | 76 | 84 | 81 | 91 | 79 | 82 | 72 | 88 | 67 | 66 | 73 |
| 2022 | 70 | 60 | 70 | 77 | 70 | 65 | 69 | 57 | 59 | 68 | 69 | 54 |
| 2023 | 61 | 71 | 60 | 48 | 51 | 76 | 68 | 66 | 71 | 81 | 69 | 75 |
| 2024 | 71 | |||||||||||
| - = No Data Reported; -- = Not Applicable; NA = Not Available; W = Withheld to avoid disclosure of individual company data. |
| Release Date: 3/29/2024 |
| Next Release Date: 4/30/2024 |