|
Download Data (XLS File) |
|
||||||||
|
||||||||
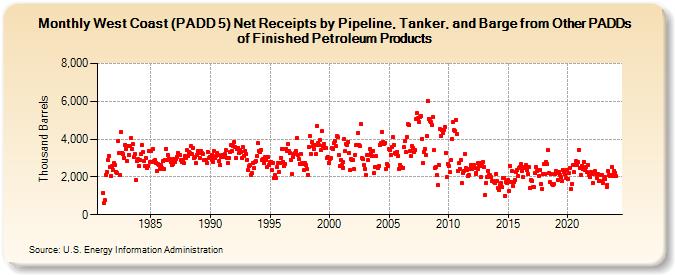
| West Coast (PADD 5) Net Receipts by Pipeline, Tanker, and Barge from Other PADDs of Finished Petroleum Products (Thousand Barrels) | ||||||||
| Year | Jan | Feb | Mar | Apr | May | Jun | Jul | Aug | Sep | Oct | Nov | Dec |
|---|---|---|---|---|---|---|---|---|---|---|---|---|
| 1981 | 1,164 | 614 | 754 | 2,108 | 2,269 | 2,869 | 3,122 | 2,504 | 2,036 | 2,563 | 2,348 | 2,742 |
| 1982 | 2,631 | 2,280 | 2,187 | 3,901 | 3,252 | 2,083 | 4,353 | 3,287 | 3,195 | 2,978 | 3,701 | 3,500 |
| 1983 | 2,827 | 3,619 | 3,159 | 3,649 | 4,061 | 3,477 | 3,726 | 3,047 | 3,210 | 1,840 | 2,833 | 2,934 |
| 1984 | 2,574 | 2,883 | 3,194 | 3,692 | 3,292 | 2,853 | 2,591 | 3,018 | 2,479 | 2,598 | 3,346 | 2,801 |
| 1985 | 3,352 | 2,776 | 3,457 | 2,818 | 2,883 | 2,749 | 2,331 | 2,682 | 2,627 | 2,434 | 2,635 | 2,492 |
| 1986 | 2,851 | 2,402 | 2,919 | 3,491 | 2,872 | 3,168 | 2,971 | 2,948 | 2,768 | 2,618 | 2,701 | 2,962 |
| 1987 | 2,805 | 2,930 | 3,058 | 3,282 | 3,162 | 3,142 | 2,879 | 2,803 | 2,920 | 2,760 | 3,102 | 3,026 |
| 1988 | 3,404 | 3,080 | 3,307 | 3,257 | 3,628 | 3,194 | 3,504 | 2,977 | 3,056 | 2,725 | 3,185 | 3,381 |
| 1989 | 3,267 | 3,000 | 3,366 | 3,283 | 3,209 | 2,876 | 2,874 | 2,907 | 2,762 | 3,337 | 2,981 | 3,071 |
| 1990 | 3,006 | 2,896 | 3,173 | 2,782 | 3,355 | 3,021 | 3,120 | 3,261 | 3,143 | 2,863 | 2,636 | 3,041 |
| 1991 | 3,162 | 3,061 | 3,028 | 3,197 | 3,409 | 2,993 | 2,753 | 2,974 | 3,299 | 3,714 | 3,350 | 3,645 |
| 1992 | 3,850 | 3,583 | 3,012 | 3,485 | 3,544 | 3,252 | 3,420 | 3,319 | 3,007 | 3,565 | 3,091 | 3,391 |
| 1993 | 3,205 | 2,918 | 2,374 | 2,551 | 2,641 | 2,093 | 2,194 | 2,723 | 2,466 | 2,790 | 2,827 | 3,092 |
| 1994 | 3,775 | 3,381 | 3,303 | 3,426 | 2,870 | 2,934 | 2,733 | 3,043 | 2,899 | 2,518 | 3,064 | 2,621 |
| 1995 | 2,794 | 2,806 | 2,354 | 2,762 | 1,922 | 2,096 | 1,940 | 2,517 | 2,735 | 2,253 | 2,734 | 3,024 |
| 1996 | 3,478 | 2,804 | 2,559 | 2,684 | 3,496 | 3,374 | 3,745 | 3,362 | 3,272 | 2,919 | 2,134 | 3,044 |
| 1997 | 3,213 | 3,269 | 3,381 | 4,060 | 3,180 | 2,959 | 2,696 | 3,236 | 2,719 | 2,697 | 2,344 | 2,724 |
| 1998 | 2,634 | 2,441 | 2,112 | 3,604 | 4,176 | 3,209 | 3,851 | 3,615 | 3,485 | 3,679 | 3,192 | 4,675 |
| 1999 | 3,788 | 3,673 | 3,965 | 3,406 | 4,422 | 3,661 | 3,754 | 3,526 | 3,550 | 3,007 | 3,076 | 2,748 |
| 2000 | 2,961 | 2,993 | 3,528 | 3,500 | 3,781 | 3,910 | 3,618 | 4,157 | 4,090 | 3,151 | 2,568 | 2,885 |
| 2001 | 2,635 | 2,776 | 2,492 | 3,994 | 3,367 | 3,749 | 3,688 | 3,871 | 3,282 | 2,346 | 2,940 | 2,874 |
| 2002 | 2,893 | 2,400 | 3,177 | 3,695 | 3,713 | 4,325 | 3,687 | 3,617 | 4,778 | 2,985 | 2,946 | 2,625 |
| 2003 | 2,400 | 2,083 | 3,157 | 2,894 | 3,169 | 3,488 | 3,246 | 3,103 | 3,375 | 2,182 | 2,513 | 3,089 |
| 2004 | 2,507 | 2,464 | 2,595 | 3,690 | 3,774 | 4,388 | 3,871 | 3,749 | 3,807 | 2,444 | 2,664 | 2,596 |
| 2005 | 3,450 | 3,405 | 3,153 | 3,604 | 4,102 | 3,714 | 3,283 | 3,234 | 3,342 | 3,125 | 2,442 | 2,632 |
| 2006 | 2,542 | 2,466 | 2,490 | 3,559 | 3,916 | 3,302 | 4,115 | 4,784 | 4,752 | 3,356 | 3,082 | 3,648 |
| 2007 | 3,551 | 3,330 | 3,434 | 5,045 | 5,368 | 5,101 | 4,887 | 5,146 | 5,201 | 4,026 | 2,740 | 3,313 |
| 2008 | 3,461 | 3,139 | 4,155 | 6,037 | 5,077 | 4,964 | 4,901 | 4,740 | 5,160 | 3,397 | 2,497 | 2,550 |
| 2009 | 2,094 | 1,557 | 2,638 | 4,513 | 4,181 | 4,478 | 4,299 | 4,483 | 4,651 | 3,286 | 1,972 | 2,671 |
| 2010 | 2,559 | 2,243 | 2,892 | 4,012 | 4,893 | 4,466 | 4,409 | 5,017 | 4,286 | 2,328 | 2,733 | 2,435 |
| 2011 | 2,901 | 1,664 | 2,209 | 2,290 | 3,215 | 2,466 | 2,342 | 2,055 | 2,124 | 2,437 | 2,604 | 2,400 |
| 2012 | 2,514 | 2,605 | 2,472 | 2,164 | 2,221 | 2,438 | 2,725 | 2,577 | 1,981 | 2,739 | 2,603 | 2,781 |
| 2013 | 2,511 | 1,046 | 1,685 | 1,998 | 2,328 | 2,125 | 2,075 | 1,969 | 1,805 | 1,775 | 1,751 | 1,668 |
| 2014 | 2,155 | 1,775 | 1,422 | 1,329 | 1,570 | 1,675 | 1,441 | 1,958 | 1,953 | 1,001 | 1,754 | 1,669 |
| 2015 | 1,849 | 1,274 | 2,581 | 1,735 | 2,291 | 1,493 | 1,756 | 1,827 | 2,274 | 2,389 | 2,038 | 2,486 |
| 2016 | 2,499 | 2,676 | 2,318 | 1,977 | 2,516 | 2,468 | 2,625 | 2,361 | 2,133 | 2,507 | 1,409 | 1,825 |
| 2017 | 1,804 | 1,471 | 1,451 | 2,203 | 2,539 | 2,327 | 2,384 | 2,066 | 2,386 | 1,617 | 1,372 | 2,173 |
| 2018 | 2,686 | 2,141 | 2,812 | 2,674 | 3,405 | 2,181 | 1,715 | 2,152 | 1,649 | 1,591 | 1,612 | 2,178 |
| 2019 | 2,333 | 2,212 | 1,848 | 2,277 | 2,077 | 1,977 | 1,768 | 2,390 | 2,242 | 2,140 | 1,946 | 2,359 |
| 2020 | 1,900 | 2,189 | 2,470 | 1,352 | 1,648 | 2,620 | 2,244 | 2,626 | 2,853 | 2,644 | 2,778 | 3,427 |
| 2021 | 2,478 | 2,125 | 2,593 | 2,416 | 2,811 | 2,374 | 2,532 | 2,238 | 2,628 | 2,085 | 1,972 | 2,256 |
| 2022 | 2,169 | 1,689 | 2,181 | 2,301 | 2,170 | 1,944 | 2,152 | 1,772 | 1,775 | 2,122 | 2,084 | 1,661 |
| 2023 | 1,888 | 1,989 | 1,874 | 1,448 | 1,595 | 2,291 | 2,096 | 2,054 | 2,122 | 2,525 | 2,065 | 2,338 |
| 2024 | 2,215 | |||||||||||
| - = No Data Reported; -- = Not Applicable; NA = Not Available; W = Withheld to avoid disclosure of individual company data. |
| Release Date: 3/29/2024 |
| Next Release Date: 4/30/2024 |