|
Download Data (XLS File) |
|
||||||||
|
||||||||
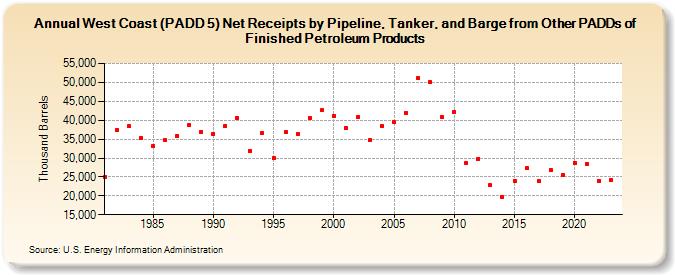
| West Coast (PADD 5) Net Receipts by Pipeline, Tanker, and Barge from Other PADDs of Finished Petroleum Products (Thousand Barrels) | ||||||||
| Decade | Year-0 | Year-1 | Year-2 | Year-3 | Year-4 | Year-5 | Year-6 | Year-7 | Year-8 | Year-9 |
|---|---|---|---|---|---|---|---|---|---|---|
| 1980's | 25,091 | 37,348 | 38,382 | 35,321 | 33,236 | 34,671 | 35,869 | 38,698 | 36,933 | |
| 1990's | 36,297 | 38,585 | 40,519 | 31,874 | 36,567 | 29,937 | 36,871 | 36,478 | 40,673 | 42,576 |
| 2000's | 41,142 | 38,014 | 40,841 | 34,699 | 38,549 | 39,486 | 42,012 | 51,142 | 50,078 | 40,823 |
| 2010's | 42,272 | 28,708 | 29,819 | 22,736 | 19,701 | 23,992 | 27,314 | 23,794 | 26,796 | 25,568 |
| 2020's | 28,749 | 28,508 | 24,018 | 24,285 |
| - = No Data Reported; -- = Not Applicable; NA = Not Available; W = Withheld to avoid disclosure of individual company data. |
| Release Date: 3/29/2024 |
| Next Release Date: 8/30/2024 |