|
Download Data (XLS File) |
|
||||||||
|
||||||||
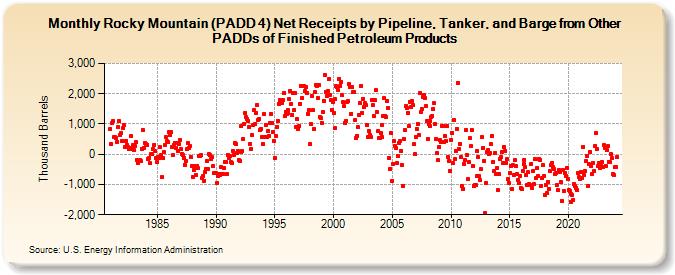
| Rocky Mountain (PADD 4) Net Receipts by Pipeline, Tanker, and Barge from Other PADDs of Finished Petroleum Products (Thousand Barrels) | ||||||||
| Year | Jan | Feb | Mar | Apr | May | Jun | Jul | Aug | Sep | Oct | Nov | Dec |
|---|---|---|---|---|---|---|---|---|---|---|---|---|
| 1981 | 839 | 344 | 1,021 | 1,094 | 576 | 558 | 535 | 414 | 897 | 1,092 | 652 | 704 |
| 1982 | 453 | 851 | 954 | 238 | 451 | 315 | 248 | 187 | 216 | 596 | 180 | 289 |
| 1983 | 138 | 257 | 393 | -179 | -294 | -210 | -189 | -212 | 176 | 800 | 222 | 375 |
| 1984 | 340 | 292 | 300 | -160 | -114 | -306 | 4 | -3 | 158 | 308 | 95 | -110 |
| 1985 | -251 | -76 | -135 | 236 | -22 | -752 | -118 | 57 | 308 | 565 | 427 | 402 |
| 1986 | 722 | 644 | 723 | 233 | -31 | 293 | 367 | 221 | 383 | 105 | 326 | 486 |
| 1987 | 185 | 19 | -12 | -111 | -343 | -240 | 160 | 361 | 214 | 268 | -99 | -385 |
| 1988 | -750 | -514 | -402 | -449 | -688 | -385 | -470 | -71 | -73 | -35 | -774 | -709 |
| 1989 | -873 | -596 | -473 | -226 | -492 | -3 | -18 | -164 | -94 | -388 | -624 | -625 |
| 1990 | -624 | -938 | -717 | -670 | -685 | -436 | -669 | -640 | -454 | -242 | -255 | -644 |
| 1991 | -18 | -114 | -44 | -271 | -295 | 123 | -19 | 380 | 327 | 41 | 119 | -199 |
| 1992 | -213 | 75 | 917 | 110 | 506 | 1,009 | 1,363 | 1,218 | 1,168 | 1,096 | 898 | 339 |
| 1993 | 173 | 641 | 982 | 1,460 | 1,006 | 1,378 | 1,637 | 1,133 | 1,174 | 802 | 846 | 577 |
| 1994 | 331 | 1,321 | 577 | 952 | 582 | 760 | 612 | 1,037 | 1,341 | 1,042 | 738 | 451 |
| 1995 | -120 | 617 | 902 | 1,112 | 1,676 | 1,807 | 1,734 | 1,706 | 1,793 | 2,021 | 1,255 | 1,408 |
| 1996 | 1,323 | 1,374 | 1,455 | 1,819 | 2,100 | 1,672 | 1,300 | 2,023 | 1,458 | 2,021 | 890 | 1,148 |
| 1997 | 840 | 932 | 1,670 | 2,264 | 1,871 | 2,264 | 2,261 | 2,078 | 2,207 | 2,040 | 1,332 | 1,461 |
| 1998 | 335 | 990 | 1,914 | 1,446 | 834 | 2,050 | 2,275 | 2,248 | 1,863 | 2,291 | 1,240 | 1,194 |
| 1999 | 1,048 | 1,389 | 1,776 | 2,616 | 2,062 | 1,932 | 2,079 | 2,479 | 1,962 | 1,788 | 1,466 | 1,735 |
| 2000 | 1,365 | 853 | 1,813 | 2,246 | 2,228 | 2,108 | 2,499 | 2,264 | 2,388 | 1,949 | 1,713 | 1,583 |
| 2001 | 1,046 | 1,103 | 1,729 | 1,751 | 2,311 | 2,208 | 1,346 | 2,218 | 2,043 | 2,061 | 1,126 | 540 |
| 2002 | 616 | 908 | 1,304 | 1,697 | 2,268 | 1,377 | 1,831 | 1,568 | 1,679 | 1,617 | 977 | 559 |
| 2003 | 770 | 646 | 584 | 1,786 | 1,611 | 1,271 | 1,779 | 2,107 | 1,394 | 756 | 533 | 534 |
| 2004 | 697 | 574 | 978 | 1,280 | 1,849 | 1,273 | 1,224 | 1,771 | 1,542 | -121 | -475 | 715 |
| 2005 | -891 | -315 | 453 | 287 | 192 | -302 | -59 | 379 | 421 | 109 | -360 | -1,039 |
| 2006 | 496 | 800 | 1,598 | 1,544 | 1,367 | 920 | 1,736 | 1,568 | 1,748 | 1,617 | 327 | -9 |
| 2007 | 578 | 845 | 1,006 | 624 | 2,009 | 1,387 | 1,502 | 1,907 | 1,945 | 1,865 | 1,590 | 1,089 |
| 2008 | 517 | 989 | 919 | 1,106 | 1,226 | 1,278 | 1,495 | 1,685 | 992 | 509 | 38 | -202 |
| 2009 | 245 | 461 | 400 | 934 | 937 | 414 | 611 | 430 | 935 | -99 | -225 | -539 |
| 2010 | 483 | 711 | -303 | 1,132 | -160 | 116 | 844 | 2,369 | 170 | 349 | -104 | -1,040 |
| 2011 | -1,147 | -312 | -203 | 793 | -21 | -834 | -271 | 525 | 260 | 816 | -393 | -1,040 |
| 2012 | -1,011 | -1,008 | -732 | 104 | -89 | -725 | -867 | -503 | 557 | 218 | -222 | -1,934 |
| 2013 | -954 | 84 | 127 | -7 | 43 | 335 | 603 | -252 | -549 | 48 | -641 | -455 |
| 2014 | -1,176 | -664 | -168 | -101 | 62 | -300 | 244 | 100 | -280 | -170 | -830 | -949 |
| 2015 | -624 | -403 | -1,150 | -365 | -687 | -194 | -405 | -663 | -867 | -945 | -709 | -1,109 |
| 2016 | -1,166 | -563 | -334 | -181 | -431 | -701 | -1,023 | -600 | -986 | -1,022 | -323 | -1,105 |
| 2017 | -547 | -998 | -173 | -780 | -456 | -728 | -159 | -193 | -1,050 | -797 | -369 | -709 |
| 2018 | -1,334 | -1,002 | -1,286 | -912 | -1,145 | -565 | -358 | -279 | -426 | -497 | -639 | -624 |
| 2019 | -1,022 | -1,188 | -520 | -580 | -926 | -1,537 | -522 | -1,216 | -622 | -723 | -449 | -819 |
| 2020 | -1,187 | -1,208 | -1,564 | -1,320 | -1,364 | -1,510 | -992 | -1,055 | -1,101 | -1,193 | -616 | -767 |
| 2021 | -835 | -603 | -773 | 247 | -677 | -566 | -226 | -71 | -1,047 | -337 | 75 | -392 |
| 2022 | -646 | -277 | -556 | 261 | 696 | 162 | -389 | -285 | -467 | -373 | -255 | -408 |
| 2023 | 292 | 199 | -374 | 135 | 259 | -247 | -261 | 1 | -141 | -648 | -696 | -438 |
| 2024 | -433 | |||||||||||
| - = No Data Reported; -- = Not Applicable; NA = Not Available; W = Withheld to avoid disclosure of individual company data. |
| Release Date: 3/29/2024 |
| Next Release Date: 4/30/2024 |