|
Download Data (XLS File) |
|
||||||||
|
||||||||
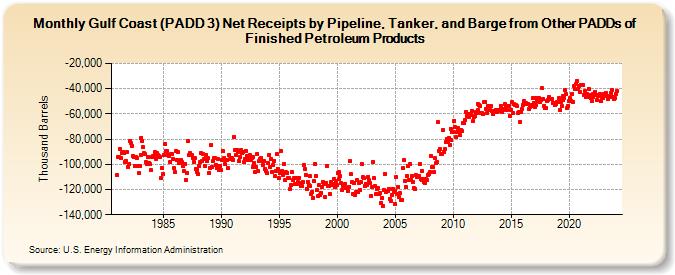
| Gulf Coast (PADD 3) Net Receipts by Pipeline, Tanker, and Barge from Other PADDs of Finished Petroleum Products (Thousand Barrels) | ||||||||
| Year | Jan | Feb | Mar | Apr | May | Jun | Jul | Aug | Sep | Oct | Nov | Dec |
|---|---|---|---|---|---|---|---|---|---|---|---|---|
| 1981 | -108,777 | -94,588 | -94,568 | -87,679 | -95,138 | -90,901 | -90,172 | -91,204 | -98,174 | -97,050 | -89,995 | -102,130 |
| 1982 | -99,382 | -81,409 | -83,392 | -85,118 | -93,387 | -94,222 | -101,536 | -94,194 | -95,114 | -101,084 | -107,152 | -101,071 |
| 1983 | -92,441 | -78,881 | -81,484 | -86,566 | -91,280 | -92,173 | -98,248 | -99,568 | -93,899 | -98,719 | -100,073 | -104,807 |
| 1984 | -94,010 | -93,527 | -93,553 | -90,605 | -95,438 | -91,421 | -92,463 | -93,456 | -94,078 | -111,000 | -102,766 | -107,935 |
| 1985 | -92,687 | -83,755 | -89,543 | -89,552 | -92,507 | -92,770 | -93,247 | -97,854 | -91,645 | -92,175 | -95,690 | -103,245 |
| 1986 | -106,381 | -89,295 | -96,192 | -90,420 | -99,185 | -97,527 | -96,406 | -98,480 | -101,459 | -105,499 | -99,371 | -112,125 |
| 1987 | -106,585 | -81,815 | -92,681 | -90,889 | -92,727 | -92,261 | -95,155 | -97,820 | -95,227 | -103,657 | -103,767 | -105,995 |
| 1988 | -107,954 | -101,360 | -97,855 | -91,424 | -97,447 | -92,023 | -95,560 | -101,705 | -92,619 | -97,465 | -95,269 | -107,066 |
| 1989 | -102,891 | -84,864 | -102,106 | -97,665 | -95,272 | -95,077 | -100,298 | -103,058 | -95,761 | -104,751 | -101,008 | -104,556 |
| 1990 | -96,247 | -89,638 | -96,017 | -95,272 | -100,036 | -96,793 | -96,656 | -103,263 | -92,645 | -95,972 | -96,067 | -95,192 |
| 1991 | -96,471 | -78,113 | -88,795 | -92,531 | -89,029 | -90,133 | -97,562 | -94,179 | -88,980 | -90,673 | -90,479 | -98,412 |
| 1992 | -95,445 | -89,240 | -93,054 | -96,335 | -94,257 | -92,952 | -96,852 | -94,839 | -94,104 | -102,371 | -99,286 | -105,828 |
| 1993 | -102,366 | -91,634 | -105,618 | -97,349 | -95,583 | -95,088 | -97,655 | -100,251 | -97,289 | -103,578 | -105,592 | -107,279 |
| 1994 | -99,092 | -92,292 | -102,398 | -95,407 | -105,722 | -100,510 | -97,048 | -109,573 | -105,071 | -92,156 | -103,437 | -111,134 |
| 1995 | -106,658 | -89,696 | -106,839 | -105,586 | -108,264 | -100,110 | -112,820 | -106,317 | -106,797 | -110,821 | -111,159 | -119,557 |
| 1996 | -116,273 | -106,243 | -112,790 | -111,009 | -115,515 | -111,054 | -115,781 | -113,903 | -110,631 | -115,015 | -117,268 | -117,406 |
| 1997 | -114,092 | -100,548 | -103,727 | -108,226 | -119,244 | -113,705 | -116,509 | -117,214 | -109,645 | -123,931 | -122,067 | -126,536 |
| 1998 | -113,440 | -99,750 | -109,245 | -120,703 | -125,283 | -116,706 | -124,653 | -122,502 | -117,859 | -113,957 | -115,497 | -125,671 |
| 1999 | -114,765 | -101,282 | -116,935 | -117,006 | -123,237 | -114,113 | -116,027 | -115,980 | -111,392 | -118,131 | -113,138 | -116,386 |
| 2000 | -107,035 | -106,146 | -111,441 | -109,481 | -115,112 | -120,432 | -117,009 | -116,555 | -115,234 | -118,958 | -118,731 | -121,004 |
| 2001 | -117,937 | -97,500 | -108,075 | -114,259 | -123,551 | -114,531 | -124,381 | -122,106 | -112,837 | -122,074 | -114,871 | -120,230 |
| 2002 | -114,098 | -99,363 | -110,378 | -111,118 | -117,218 | -115,973 | -115,708 | -116,149 | -109,754 | -112,699 | -114,896 | -125,032 |
| 2003 | -117,844 | -98,057 | -111,261 | -117,214 | -123,946 | -119,715 | -119,016 | -123,493 | -122,737 | -130,681 | -126,593 | -133,039 |
| 2004 | -120,058 | -107,683 | -122,033 | -121,133 | -121,537 | -119,474 | -127,459 | -128,755 | -124,095 | -119,317 | -121,976 | -131,284 |
| 2005 | -121,300 | -110,223 | -123,168 | -117,749 | -126,173 | -123,094 | -128,380 | -128,591 | -103,210 | -96,907 | -112,915 | -117,786 |
| 2006 | -108,941 | -101,210 | -112,382 | -100,031 | -112,310 | -109,380 | -114,159 | -118,827 | -119,276 | -108,605 | -110,078 | -109,257 |
| 2007 | -109,279 | -100,153 | -111,383 | -105,347 | -112,281 | -111,542 | -114,172 | -114,789 | -111,608 | -112,462 | -108,391 | -107,899 |
| 2008 | -106,231 | -93,421 | -102,002 | -102,405 | -106,063 | -95,302 | -98,769 | -98,315 | -66,797 | -89,272 | -88,251 | -91,897 |
| 2009 | -91,566 | -73,042 | -90,020 | -88,001 | -82,192 | -79,809 | -82,688 | -78,968 | -84,808 | -71,698 | -80,646 | -74,580 |
| 2010 | -74,134 | -65,609 | -70,765 | -78,597 | -74,716 | -71,363 | -73,705 | -76,806 | -72,538 | -73,504 | -67,062 | -67,497 |
| 2011 | -65,027 | -58,125 | -61,554 | -60,156 | -62,071 | -60,021 | -61,030 | -57,670 | -65,991 | -62,535 | -61,694 | -58,527 |
| 2012 | -59,118 | -51,856 | -57,252 | -52,906 | -53,932 | -58,927 | -59,247 | -60,135 | -50,523 | -50,491 | -56,450 | -59,633 |
| 2013 | -54,075 | -54,030 | -57,013 | -54,060 | -58,089 | -60,337 | -57,415 | -57,809 | -56,743 | -58,447 | -56,829 | -58,038 |
| 2014 | -56,616 | -53,384 | -58,186 | -56,515 | -55,922 | -52,289 | -54,543 | -56,888 | -53,835 | -53,535 | -53,757 | -61,576 |
| 2015 | -56,587 | -50,669 | -59,064 | -52,366 | -53,314 | -53,219 | -53,896 | -59,033 | -58,681 | -66,053 | -58,480 | -56,045 |
| 2016 | -52,636 | -49,945 | -52,085 | -51,606 | -52,066 | -52,063 | -55,758 | -54,289 | -52,667 | -54,033 | -47,535 | -50,995 |
| 2017 | -54,441 | -47,423 | -53,323 | -49,993 | -49,756 | -47,699 | -50,315 | -48,988 | -39,810 | -48,265 | -53,507 | -55,254 |
| 2018 | -55,193 | -49,540 | -48,915 | -46,784 | -48,030 | -47,898 | -48,092 | -51,055 | -51,472 | -52,708 | -52,379 | -50,880 |
| 2019 | -50,954 | -47,559 | -56,993 | -50,534 | -53,868 | -48,850 | -45,994 | -47,153 | -41,142 | -44,534 | -55,174 | -53,744 |
| 2020 | -50,040 | -47,727 | -49,518 | -44,135 | -50,293 | -37,894 | -40,036 | -36,614 | -33,751 | -40,389 | -37,742 | -42,276 |
| 2021 | -36,840 | -37,214 | -37,035 | -44,856 | -41,879 | -46,545 | -44,013 | -46,790 | -39,864 | -44,995 | -47,589 | -49,687 |
| 2022 | -46,577 | -43,989 | -44,464 | -42,310 | -44,985 | -49,053 | -45,445 | -45,134 | -44,423 | -49,943 | -46,912 | -47,092 |
| 2023 | -43,969 | -44,207 | -43,257 | -45,497 | -48,108 | -46,965 | -46,672 | -43,037 | -41,222 | -46,952 | -48,339 | -47,226 |
| 2024 | -44,045 | |||||||||||
| - = No Data Reported; -- = Not Applicable; NA = Not Available; W = Withheld to avoid disclosure of individual company data. |
| Release Date: 3/29/2024 |
| Next Release Date: 4/30/2024 |