|
Download Data (XLS File) |
|
||||||||
|
||||||||
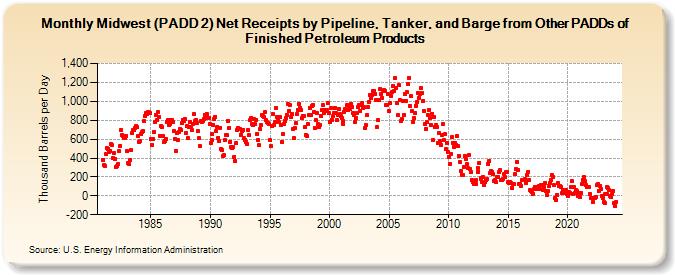
| Midwest (PADD 2) Net Receipts by Pipeline, Tanker, and Barge from Other PADDs of Finished Petroleum Products (Thousand Barrels per Day) | ||||||||
| Year | Jan | Feb | Mar | Apr | May | Jun | Jul | Aug | Sep | Oct | Nov | Dec |
|---|---|---|---|---|---|---|---|---|---|---|---|---|
| 1981 | 383 | 328 | 318 | 445 | 501 | 498 | 466 | 477 | 550 | 535 | 402 | 454 |
| 1982 | 393 | 301 | 311 | 335 | 471 | 532 | 697 | 645 | 629 | 615 | 610 | 634 |
| 1983 | 471 | 348 | 333 | 378 | 483 | 663 | 691 | 695 | 718 | 737 | 725 | 632 |
| 1984 | 571 | 577 | 653 | 676 | 683 | 787 | 844 | 879 | 863 | 890 | 887 | 876 |
| 1985 | 604 | 541 | 600 | 678 | 782 | 855 | 797 | 886 | 832 | 638 | 742 | 723 |
| 1986 | 637 | 570 | 578 | 604 | 786 | 805 | 744 | 759 | 805 | 799 | 785 | 685 |
| 1987 | 605 | 476 | 662 | 595 | 680 | 702 | 692 | 770 | 803 | 788 | 814 | 669 |
| 1988 | 735 | 610 | 730 | 780 | 732 | 692 | 762 | 861 | 790 | 802 | 768 | 688 |
| 1989 | 607 | 527 | 790 | 780 | 791 | 813 | 855 | 833 | 869 | 828 | 828 | 755 |
| 1990 | 562 | 592 | 650 | 754 | 808 | 838 | 681 | 731 | 616 | 579 | 718 | 492 |
| 1991 | 482 | 422 | 427 | 589 | 648 | 639 | 796 | 718 | 573 | 516 | 503 | 515 |
| 1992 | 410 | 372 | 554 | 700 | 717 | 702 | 706 | 648 | 681 | 699 | 608 | 588 |
| 1993 | 572 | 549 | 698 | 642 | 799 | 828 | 763 | 748 | 808 | 755 | 806 | 658 |
| 1994 | 592 | 534 | 709 | 749 | 855 | 841 | 831 | 884 | 798 | 777 | 766 | 759 |
| 1995 | 589 | 526 | 737 | 861 | 748 | 783 | 924 | 829 | 814 | 778 | 829 | 749 |
| 1996 | 573 | 650 | 762 | 794 | 822 | 859 | 975 | 902 | 958 | 829 | 866 | 707 |
| 1997 | 608 | 716 | 770 | 862 | 911 | 975 | 933 | 907 | 819 | 848 | 847 | 727 |
| 1998 | 646 | 635 | 757 | 856 | 934 | 857 | 953 | 963 | 891 | 716 | 803 | 871 |
| 1999 | 761 | 723 | 753 | 849 | 906 | 962 | 877 | 905 | 900 | 907 | 977 | 873 |
| 2000 | 785 | 929 | 807 | 841 | 874 | 933 | 877 | 799 | 857 | 922 | 861 | 849 |
| 2001 | 827 | 790 | 758 | 887 | 914 | 905 | 966 | 906 | 948 | 921 | 974 | 938 |
| 2002 | 879 | 851 | 784 | 828 | 880 | 940 | 958 | 896 | 963 | 979 | 933 | 938 |
| 2003 | 716 | 747 | 851 | 936 | 991 | 1,063 | 1,038 | 1,069 | 1,112 | 1,110 | 1,078 | 1,016 |
| 2004 | 724 | 797 | 1,012 | 1,129 | 1,078 | 1,039 | 1,112 | 1,123 | 1,107 | 959 | 964 | 1,073 |
| 2005 | 894 | 980 | 1,060 | 1,103 | 1,161 | 1,109 | 1,242 | 1,140 | 979 | 850 | 1,168 | 1,010 |
| 2006 | 793 | 811 | 1,003 | 859 | 1,081 | 1,008 | 1,093 | 1,178 | 1,250 | 955 | 1,051 | 894 |
| 2007 | 783 | 827 | 877 | 951 | 993 | 1,088 | 1,040 | 1,078 | 1,144 | 1,089 | 1,004 | 898 |
| 2008 | 765 | 711 | 777 | 856 | 912 | 827 | 752 | 869 | 587 | 837 | 730 | 745 |
| 2009 | 728 | 564 | 663 | 575 | 535 | 644 | 757 | 588 | 649 | 493 | 562 | 459 |
| 2010 | 412 | 336 | 443 | 619 | 564 | 520 | 557 | 538 | 629 | 526 | 425 | 356 |
| 2011 | 261 | 224 | 218 | 303 | 417 | 393 | 333 | 290 | 430 | 288 | 247 | 167 |
| 2012 | 148 | 129 | 148 | 128 | 167 | 298 | 252 | 351 | 184 | 179 | 141 | 195 |
| 2013 | 115 | 141 | 163 | 180 | 334 | 370 | 238 | 263 | 253 | 227 | 154 | 165 |
| 2014 | 143 | 196 | 199 | 247 | 268 | 172 | 165 | 182 | 230 | 196 | 250 | 256 |
| 2015 | 147 | 136 | 150 | 137 | 86 | 126 | 130 | 232 | 280 | 358 | 273 | 128 |
| 2016 | 124 | 107 | 165 | 170 | 172 | 176 | 135 | 220 | 257 | 166 | 58 | 52 |
| 2017 | 38 | 22 | 69 | 93 | 89 | 74 | 74 | 104 | 68 | 111 | 114 | 65 |
| 2018 | 96 | 133 | 51 | 9 | 46 | 105 | 135 | 164 | 215 | 197 | 112 | -28 |
| 2019 | -40 | 11 | 132 | 108 | 107 | 97 | 25 | 59 | 42 | 34 | 62 | 18 |
| 2020 | -7 | 39 | 29 | 91 | 152 | 23 | 91 | 35 | 60 | 49 | -2 | 32 |
| 2021 | -16 | 25 | 122 | 170 | 201 | 153 | 112 | 91 | 88 | 88 | 22 | -23 |
| 2022 | -20 | -61 | -25 | -25 | -13 | 116 | 123 | 54 | 109 | 76 | -2 | -23 |
| 2023 | -67 | -72 | 21 | 19 | 91 | 80 | 57 | -2 | -15 | 15 | 51 | -74 |
| 2024 | -108 | |||||||||||
| - = No Data Reported; -- = Not Applicable; NA = Not Available; W = Withheld to avoid disclosure of individual company data. |
| Release Date: 3/29/2024 |
| Next Release Date: 4/30/2024 |