|
Download Data (XLS File) |
|
||||||||
|
||||||||
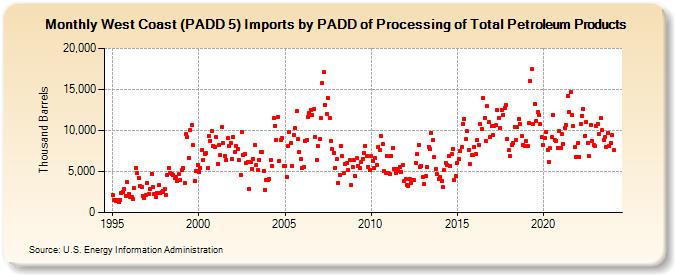
| West Coast (PADD 5) Imports by PADD of Processing of Total Petroleum Products (Thousand Barrels) | ||||||||
| Year | Jan | Feb | Mar | Apr | May | Jun | Jul | Aug | Sep | Oct | Nov | Dec |
|---|---|---|---|---|---|---|---|---|---|---|---|---|
| 1995 | 2,122 | 1,576 | 1,365 | 1,579 | 1,319 | 1,580 | 2,357 | 2,490 | 2,899 | 2,062 | 3,701 | 2,310 |
| 1996 | 1,949 | 1,862 | 1,607 | 2,936 | 5,427 | 4,817 | 4,251 | 3,256 | 3,115 | 2,058 | 1,715 | 2,146 |
| 1997 | 3,627 | 2,303 | 2,822 | 4,756 | 3,069 | 2,247 | 1,884 | 2,370 | 3,344 | 2,439 | 2,562 | 2,667 |
| 1998 | 2,905 | 2,111 | 4,515 | 5,460 | 4,826 | 4,677 | 4,588 | 4,242 | 4,321 | 3,841 | 4,679 | 3,977 |
| 1999 | 5,154 | 5,401 | 3,661 | 9,534 | 9,172 | 6,619 | 10,072 | 10,618 | 8,202 | 3,840 | 5,096 | 5,839 |
| 2000 | 4,932 | 5,451 | 7,658 | 6,415 | 7,191 | 7,240 | 5,451 | 9,386 | 8,765 | 9,982 | 8,164 | 8,008 |
| 2001 | 9,210 | 5,921 | 8,196 | 7,004 | 10,390 | 8,501 | 6,938 | 6,376 | 9,031 | 8,054 | 8,478 | 6,548 |
| 2002 | 9,257 | 7,431 | 8,118 | 7,791 | 6,387 | 4,635 | 9,874 | 7,021 | 7,099 | 6,074 | 6,201 | 2,886 |
| 2003 | 6,129 | 5,302 | 6,523 | 8,238 | 5,777 | 5,236 | 6,448 | 7,393 | 7,327 | 5,046 | 2,797 | 3,920 |
| 2004 | 3,922 | 4,082 | 6,397 | 5,697 | 11,466 | 10,602 | 8,872 | 11,590 | 6,259 | 8,829 | 9,032 | 5,705 |
| 2005 | 5,677 | 4,308 | 8,126 | 9,804 | 8,464 | 5,692 | 9,469 | 10,256 | 12,322 | 8,901 | 7,361 | 6,499 |
| 2006 | 5,417 | 5,509 | 8,755 | 8,856 | 11,623 | 12,155 | 12,512 | 11,876 | 12,573 | 9,155 | 6,410 | 8,084 |
| 2007 | 8,906 | 11,567 | 15,734 | 17,076 | 13,116 | 12,053 | 13,959 | 11,548 | 8,747 | 7,737 | 7,297 | 5,433 |
| 2008 | 6,476 | 3,639 | 4,634 | 8,155 | 6,843 | 4,833 | 5,950 | 6,003 | 5,202 | 6,386 | 3,328 | 5,580 |
| 2009 | 6,412 | 4,413 | 6,598 | 5,713 | 5,374 | 6,126 | 6,544 | 7,217 | 8,137 | 6,914 | 5,557 | 5,184 |
| 2010 | 6,848 | 6,224 | 5,372 | 6,632 | 5,774 | 8,006 | 7,573 | 9,303 | 8,334 | 5,007 | 4,839 | 6,858 |
| 2011 | 4,810 | 4,666 | 6,871 | 7,925 | 5,348 | 4,876 | 5,290 | 5,063 | 5,561 | 4,991 | 5,785 | 3,825 |
| 2012 | 4,058 | 3,352 | 3,208 | 4,038 | 3,644 | 3,999 | 3,913 | 6,070 | 7,082 | 8,250 | 5,600 | 5,620 |
| 2013 | 4,299 | 3,470 | 4,396 | 5,569 | 8,014 | 7,701 | 9,715 | 8,809 | 6,713 | 5,282 | 4,659 | 4,067 |
| 2014 | 4,345 | 3,797 | 3,081 | 5,141 | 6,013 | 5,847 | 6,849 | 5,719 | 7,084 | 7,768 | 3,982 | 4,430 |
| 2015 | 6,021 | 6,519 | 7,496 | 7,942 | 10,729 | 11,410 | 8,922 | 9,877 | 7,616 | 5,915 | 6,962 | 6,981 |
| 2016 | 7,968 | 7,177 | 8,862 | 8,291 | 10,756 | 10,206 | 13,967 | 11,543 | 8,678 | 12,922 | 11,023 | 9,250 |
| 2017 | 10,553 | 9,453 | 10,548 | 10,607 | 12,441 | 11,493 | 10,318 | 12,509 | 11,921 | 12,743 | 13,121 | 9,011 |
| 2018 | 7,562 | 6,881 | 8,280 | 8,482 | 10,444 | 8,876 | 10,480 | 11,445 | 10,813 | 9,303 | 8,210 | 8,146 |
| 2019 | 8,698 | 8,121 | 10,870 | 16,025 | 17,484 | 10,748 | 13,226 | 11,147 | 12,194 | 11,888 | 10,747 | 9,172 |
| 2020 | 8,215 | 9,083 | 9,873 | 7,614 | 6,218 | 7,811 | 9,230 | 11,923 | 8,838 | 8,658 | 7,871 | 9,880 |
| 2021 | 7,805 | 9,559 | 8,319 | 10,255 | 10,659 | 14,177 | 12,232 | 14,676 | 11,869 | 10,510 | 7,970 | 6,754 |
| 2022 | 8,486 | 6,769 | 10,815 | 11,772 | 12,621 | 9,375 | 11,003 | 8,530 | 6,893 | 10,715 | 8,690 | 8,222 |
| 2023 | 8,082 | 10,534 | 10,730 | 9,602 | 11,459 | 9,999 | 8,813 | 9,212 | 8,040 | 9,751 | 8,129 | 8,482 |
| 2024 | 9,489 | |||||||||||
| - = No Data Reported; -- = Not Applicable; NA = Not Available; W = Withheld to avoid disclosure of individual company data. |
| Release Date: 3/29/2024 |
| Next Release Date: 4/30/2024 |