|
Download Data (XLS File) |
|
||||||||
|
||||||||
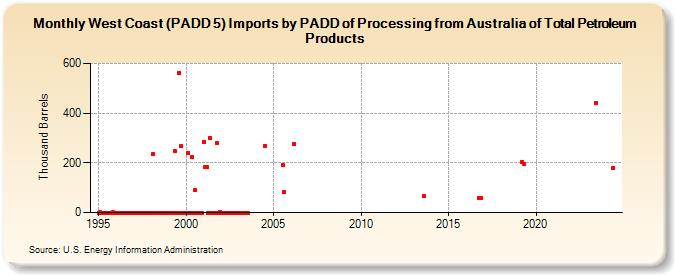
| West Coast (PADD 5) Imports by PADD of Processing from Australia of Total Petroleum Products (Thousand Barrels) | ||||||||
| Year | Jan | Feb | Mar | Apr | May | Jun | Jul | Aug | Sep | Oct | Nov | Dec |
|---|---|---|---|---|---|---|---|---|---|---|---|---|
| 1995 | 0 | 1 | 0 | 0 | 0 | 0 | 0 | 0 | 0 | 0 | 1 | 0 |
| 1996 | 0 | 0 | 0 | 0 | 0 | 0 | 0 | 0 | 0 | 0 | 0 | 0 |
| 1997 | 0 | 0 | 0 | 0 | 0 | 0 | 0 | 0 | 0 | 0 | 0 | 0 |
| 1998 | 0 | 235 | 0 | 0 | 0 | 0 | 0 | 0 | 0 | 0 | 0 | 0 |
| 1999 | 0 | 0 | 0 | 0 | 247 | 0 | 0 | 563 | 267 | 0 | 0 | 0 |
| 2000 | 0 | 241 | 0 | 0 | 223 | 0 | 90 | 0 | 0 | 0 | 0 | 0 |
| 2001 | 284 | 184 | 183 | 0 | 302 | 0 | 0 | 0 | 0 | 281 | 0 | 3 |
| 2002 | 0 | 0 | 0 | 0 | 0 | 0 | 0 | 0 | 0 | 0 | 0 | 0 |
| 2003 | 0 | 0 | 0 | 0 | 0 | 0 | 0 | |||||
| 2004 | 269 | |||||||||||
| 2005 | 192 | 84 | ||||||||||
| 2006 | 277 | |||||||||||
| 2013 | 66 | |||||||||||
| 2016 | 59 | 58 | ||||||||||
| 2019 | 202 | 196 | ||||||||||
| 2023 | 442 | |||||||||||
| 2024 | 180 | |||||||||||
| - = No Data Reported; -- = Not Applicable; NA = Not Available; W = Withheld to avoid disclosure of individual company data. |
| Release Date: 8/30/2024 |
| Next Release Date: 9/30/2024 |