|
Download Data (XLS File) |
|
||||||||
|
||||||||
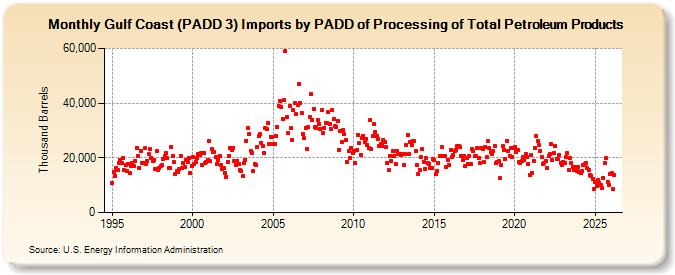
| Gulf Coast (PADD 3) Imports by PADD of Processing of Total Petroleum Products (Thousand Barrels) | ||||||||
| Year | Jan | Feb | Mar | Apr | May | Jun | Jul | Aug | Sep | Oct | Nov | Dec |
|---|---|---|---|---|---|---|---|---|---|---|---|---|
| 1995 | 10,932 | 14,800 | 13,326 | 16,301 | 15,572 | 18,178 | 19,350 | 18,144 | 19,897 | 15,596 | 17,233 | 15,371 |
| 1996 | 17,744 | 14,395 | 17,120 | 18,170 | 17,041 | 18,915 | 23,740 | 20,778 | 16,352 | 22,680 | 18,268 | 18,223 |
| 1997 | 23,490 | 17,910 | 18,985 | 21,239 | 23,074 | 19,912 | 18,922 | 19,334 | 16,028 | 22,609 | 15,554 | 16,126 |
| 1998 | 17,132 | 17,276 | 19,539 | 20,570 | 21,745 | 19,794 | 16,428 | 16,158 | 24,013 | 20,698 | 18,538 | 14,080 |
| 1999 | 15,196 | 14,752 | 16,020 | 20,776 | 16,272 | 18,220 | 16,751 | 19,334 | 18,597 | 19,798 | 14,579 | 17,099 |
| 2000 | 20,249 | 17,603 | 18,621 | 19,975 | 21,252 | 20,871 | 21,646 | 17,281 | 21,759 | 18,023 | 18,328 | 19,098 |
| 2001 | 26,137 | 18,726 | 23,111 | 21,967 | 22,151 | 20,150 | 17,890 | 19,294 | 20,832 | 17,319 | 16,038 | 16,105 |
| 2002 | 14,539 | 12,866 | 18,411 | 20,802 | 23,472 | 22,802 | 23,760 | 18,980 | 17,512 | 18,750 | 17,721 | 15,533 |
| 2003 | 15,206 | 13,197 | 17,948 | 19,327 | 26,284 | 30,841 | 28,585 | 22,588 | 21,735 | 15,053 | 17,835 | 17,312 |
| 2004 | 23,890 | 27,916 | 28,596 | 25,565 | 24,206 | 21,858 | 30,744 | 30,505 | 32,824 | 25,221 | 27,771 | 27,610 |
| 2005 | 24,956 | 25,014 | 27,984 | 31,445 | 39,056 | 40,795 | 38,494 | 34,258 | 41,042 | 58,897 | 34,851 | 28,959 |
| 2006 | 39,119 | 30,909 | 26,401 | 37,384 | 40,041 | 35,908 | 39,203 | 46,952 | 40,169 | 36,484 | 28,782 | 27,175 |
| 2007 | 31,052 | 23,221 | 31,154 | 34,996 | 43,180 | 33,814 | 38,018 | 31,446 | 31,016 | 33,891 | 32,349 | 30,721 |
| 2008 | 37,385 | 29,183 | 31,031 | 32,811 | 32,795 | 36,674 | 32,353 | 30,477 | 37,391 | 34,319 | 31,618 | 31,401 |
| 2009 | 33,602 | 23,027 | 29,830 | 25,613 | 30,245 | 28,550 | 26,591 | 18,606 | 22,384 | 19,762 | 23,763 | 21,901 |
| 2010 | 22,467 | 18,117 | 22,747 | 28,319 | 25,405 | 21,145 | 27,302 | 28,074 | 25,640 | 27,040 | 24,800 | 23,461 |
| 2011 | 33,809 | 23,155 | 27,878 | 32,186 | 29,504 | 28,026 | 26,812 | 24,385 | 24,980 | 24,429 | 26,701 | 25,763 |
| 2012 | 23,929 | 18,090 | 15,401 | 20,794 | 18,734 | 22,535 | 20,730 | 17,657 | 22,448 | 21,560 | 21,583 | 20,979 |
| 2013 | 21,335 | 17,448 | 21,231 | 24,666 | 28,334 | 21,505 | 25,696 | 24,622 | 26,051 | 26,281 | 22,480 | 17,267 |
| 2014 | 13,958 | 15,668 | 20,239 | 23,124 | 18,544 | 16,007 | 20,003 | 18,031 | 17,691 | 16,104 | 16,174 | 19,482 |
| 2015 | 19,110 | 13,934 | 15,101 | 18,123 | 20,572 | 20,848 | 23,824 | 20,626 | 20,598 | 16,541 | 19,178 | 17,318 |
| 2016 | 22,936 | 20,255 | 21,072 | 22,505 | 22,813 | 24,425 | 24,190 | 24,010 | 20,732 | 19,028 | 20,608 | 16,875 |
| 2017 | 19,993 | 17,739 | 20,688 | 17,891 | 23,118 | 22,502 | 20,575 | 20,504 | 23,420 | 19,914 | 17,952 | 23,714 |
| 2018 | 23,068 | 18,523 | 23,965 | 20,361 | 26,239 | 23,555 | 22,227 | 21,535 | 22,662 | 24,329 | 18,269 | 18,438 |
| 2019 | 18,778 | 12,489 | 17,250 | 24,277 | 22,989 | 19,598 | 26,268 | 22,464 | 20,502 | 23,535 | 20,236 | 23,759 |
| 2020 | 23,873 | 21,966 | 22,787 | 18,309 | 17,980 | 18,908 | 20,187 | 19,169 | 21,471 | 20,251 | 17,886 | 13,908 |
| 2021 | 21,105 | 14,611 | 18,984 | 23,679 | 27,951 | 26,026 | 24,548 | 22,671 | 20,233 | 17,888 | 18,240 | 18,893 |
| 2022 | 16,366 | 20,744 | 21,493 | 25,178 | 19,112 | 21,608 | 24,163 | 19,552 | 19,481 | 21,160 | 18,094 | 17,382 |
| 2023 | 18,480 | 17,992 | 20,198 | 21,689 | 15,602 | 19,914 | 18,021 | 16,807 | 15,670 | 16,660 | 15,199 | 16,549 |
| 2024 | 14,883 | |||||||||||
| - = No Data Reported; -- = Not Applicable; NA = Not Available; W = Withheld to avoid disclosure of individual company data. |
| Release Date: 3/29/2024 |
| Next Release Date: 4/30/2024 |