|
Download Data (XLS File) |
|
||||||||
|
||||||||
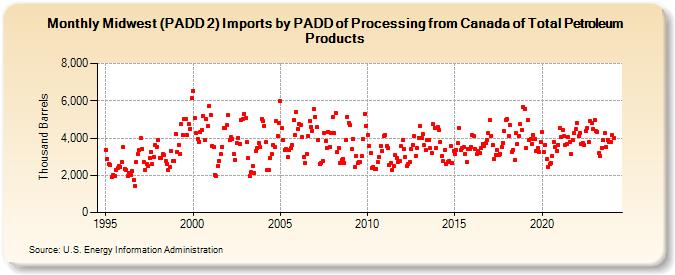
| Midwest (PADD 2) Imports by PADD of Processing from Canada of Total Petroleum Products (Thousand Barrels) | ||||||||
| Year | Jan | Feb | Mar | Apr | May | Jun | Jul | Aug | Sep | Oct | Nov | Dec |
|---|---|---|---|---|---|---|---|---|---|---|---|---|
| 1995 | 3,382 | 2,875 | 2,603 | 2,577 | 1,886 | 2,026 | 1,976 | 2,307 | 2,374 | 2,484 | 2,466 | 2,707 |
| 1996 | 3,494 | 2,353 | 2,288 | 1,974 | 2,109 | 1,992 | 2,247 | 1,750 | 1,436 | 2,702 | 3,117 | 3,366 |
| 1997 | 3,984 | 3,426 | 2,702 | 2,295 | 2,624 | 2,503 | 2,917 | 3,269 | 2,581 | 2,996 | 3,610 | 3,536 |
| 1998 | 3,884 | 2,930 | 2,917 | 3,128 | 3,108 | 2,775 | 2,624 | 2,267 | 2,460 | 3,293 | 2,772 | 2,774 |
| 1999 | 4,242 | 3,261 | 3,640 | 3,165 | 4,739 | 4,162 | 5,031 | 5,013 | 4,141 | 4,759 | 4,498 | 6,131 |
| 2000 | 6,548 | 5,057 | 4,256 | 3,964 | 3,788 | 4,297 | 4,445 | 5,183 | 3,911 | 5,020 | 4,644 | 5,706 |
| 2001 | 5,249 | 3,588 | 3,523 | 2,036 | 1,944 | 2,484 | 2,788 | 3,128 | 3,540 | 4,547 | 4,530 | 4,678 |
| 2002 | 5,212 | 3,881 | 4,048 | 3,970 | 3,146 | 2,839 | 3,708 | 4,011 | 3,676 | 4,982 | 5,016 | 5,312 |
| 2003 | 5,098 | 3,786 | 2,932 | 1,988 | 2,176 | 2,482 | 2,142 | 3,291 | 3,451 | 3,715 | 3,531 | 5,038 |
| 2004 | 4,926 | 4,664 | 3,775 | 2,274 | 2,304 | 2,930 | 3,127 | 3,616 | 3,493 | 4,909 | 4,096 | 4,819 |
| 2005 | 5,983 | 4,516 | 3,900 | 3,379 | 3,395 | 2,999 | 3,348 | 3,476 | 3,649 | 4,971 | 4,154 | 5,410 |
| 2006 | 4,508 | 4,767 | 4,701 | 4,043 | 2,987 | 2,645 | 3,137 | 4,114 | 4,924 | 4,569 | 4,380 | 5,554 |
| 2007 | 5,150 | 4,574 | 3,900 | 2,595 | 2,685 | 2,766 | 4,274 | 3,864 | 3,454 | 4,337 | 3,520 | 4,266 |
| 2008 | 5,146 | 4,254 | 5,367 | 3,238 | 3,478 | 2,679 | 2,827 | 2,901 | 2,681 | 3,875 | 5,142 | 4,816 |
| 2009 | 4,679 | 3,405 | 3,958 | 2,432 | 3,031 | 2,659 | 2,732 | 2,700 | 3,015 | 3,929 | 5,291 | 4,660 |
| 2010 | 4,143 | 3,568 | 3,175 | 2,414 | 2,453 | 2,317 | 2,339 | 2,690 | 2,986 | 3,560 | 3,326 | 4,115 |
| 2011 | 4,187 | 3,558 | 3,466 | 2,558 | 2,681 | 2,310 | 2,483 | 3,094 | 2,921 | 2,740 | 2,758 | 3,550 |
| 2012 | 3,888 | 3,417 | 2,958 | 2,501 | 2,581 | 2,736 | 3,403 | 3,639 | 4,100 | 3,058 | 3,438 | 4,015 |
| 2013 | 4,645 | 4,006 | 4,207 | 3,608 | 3,354 | 3,897 | 3,914 | 3,439 | 3,212 | 4,764 | 4,548 | 3,483 |
| 2014 | 4,578 | 4,409 | 3,791 | 3,015 | 2,766 | 3,351 | 2,594 | 2,722 | 2,743 | 3,579 | 2,634 | 3,325 |
| 2015 | 3,156 | 3,360 | 3,722 | 4,520 | 3,331 | 3,462 | 3,516 | 3,138 | 2,691 | 3,400 | 3,435 | 3,527 |
| 2016 | 4,165 | 4,090 | 3,419 | 3,129 | 3,301 | 3,208 | 3,460 | 3,674 | 3,548 | 3,714 | 3,907 | 4,261 |
| 2017 | 4,986 | 4,116 | 3,633 | 2,887 | 3,113 | 3,344 | 3,085 | 3,161 | 3,502 | 3,751 | 4,386 | 4,973 |
| 2018 | 5,005 | 4,102 | 4,686 | 3,259 | 3,374 | 2,821 | 4,275 | 3,703 | 4,130 | 4,750 | 4,441 | 5,661 |
| 2019 | 5,563 | 3,490 | 4,958 | 3,908 | 3,941 | 3,698 | 4,149 | 3,947 | 3,294 | 3,490 | 3,228 | 3,782 |
| 2020 | 4,297 | 3,276 | 3,647 | 2,867 | 2,461 | 2,587 | 2,655 | 3,040 | 3,798 | 3,541 | 3,298 | 3,646 |
| 2021 | 4,531 | 4,057 | 4,444 | 4,082 | 3,636 | 3,680 | 4,031 | 3,801 | 3,156 | 3,918 | 4,278 | 4,464 |
| 2022 | 4,784 | 4,100 | 4,273 | 3,705 | 3,740 | 3,625 | 4,403 | 4,550 | 3,764 | 4,892 | 4,824 | 4,494 |
| 2023 | 4,955 | 4,356 | 4,332 | 3,187 | 3,041 | 3,481 | 3,893 | 4,248 | 3,499 | 3,872 | 3,811 | 3,796 |
| 2024 | 4,145 | |||||||||||
| - = No Data Reported; -- = Not Applicable; NA = Not Available; W = Withheld to avoid disclosure of individual company data. |
| Release Date: 3/29/2024 |
| Next Release Date: 4/30/2024 |