|
Download Data (XLS File) |
|
||||||||
|
||||||||
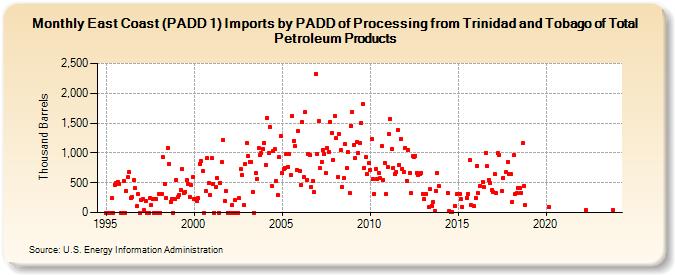
| East Coast (PADD 1) Imports by PADD of Processing from Trinidad and Tobago of Total Petroleum Products (Thousand Barrels) | ||||||||
| Year | Jan | Feb | Mar | Apr | May | Jun | Jul | Aug | Sep | Oct | Nov | Dec |
|---|---|---|---|---|---|---|---|---|---|---|---|---|
| 1995 | 0 | 0 | 0 | 0 | 238 | 0 | 467 | 497 | 519 | 479 | 0 | 0 |
| 1996 | 521 | 0 | 360 | 590 | 673 | 250 | 261 | 543 | 404 | 104 | 308 | 0 |
| 1997 | 217 | 225 | 35 | 200 | 0 | 0 | 240 | 123 | 231 | 0 | 234 | 0 |
| 1998 | 312 | 0 | 307 | 926 | 486 | 241 | 1,080 | 818 | 175 | 229 | 0 | 220 |
| 1999 | 546 | 260 | 300 | 382 | 732 | 331 | 350 | 540 | 481 | 268 | 462 | 591 |
| 2000 | 230 | 230 | 200 | 236 | 821 | 857 | 697 | 0 | 363 | 910 | 495 | 300 |
| 2001 | 914 | 485 | 0 | 426 | 573 | 0 | 500 | 843 | 1,213 | 198 | 359 | 0 |
| 2002 | 0 | 0 | 125 | 0 | 214 | 0 | 0 | 239 | 724 | 630 | 125 | 822 |
| 2003 | 1,165 | 943 | 856 | 840 | 343 | 0 | 660 | 566 | 1,082 | 957 | 994 | 1,066 |
| 2004 | 1,168 | 801 | 1,585 | 1,007 | 1,438 | 448 | 1,030 | 1,060 | 528 | 294 | 925 | 1,281 |
| 2005 | 666 | 724 | 747 | 978 | 765 | 981 | 634 | 1,616 | 1,206 | 1,109 | 711 | 1,368 |
| 2006 | 705 | 466 | 1,522 | 592 | 1,683 | 554 | 984 | 960 | 426 | 522 | 347 | 2,328 |
| 2007 | 979 | 1,542 | 743 | 852 | 1,056 | 976 | 660 | 1,082 | 1,022 | 1,524 | 1,338 | 884 |
| 2008 | 1,619 | 1,245 | 600 | 1,313 | 1,051 | 430 | 572 | 1,142 | 743 | 1,012 | 330 | 1,455 |
| 2009 | 1,688 | 1,137 | 911 | 1,179 | 1,005 | 1,167 | 1,507 | 1,816 | 755 | 931 | 640 | 825 |
| 2010 | 716 | 1,229 | 560 | 318 | 730 | 560 | 670 | 578 | 1,112 | 545 | 834 | 310 |
| 2011 | 769 | 1,311 | 1,568 | 1,070 | 755 | 640 | 682 | 1,386 | 798 | 1,233 | 736 | 674 |
| 2012 | 1,088 | 534 | 1,047 | 668 | 321 | 943 | 934 | 952 | 669 | 635 | 639 | 669 |
| 2013 | 318 | 220 | 311 | 87 | 387 | 115 | 174 | 24 | 366 | 666 | 442 | |
| 2014 | 330 | 25 | 16 | 3 | 110 | 309 | ||||||
| 2015 | 309 | 319 | 224 | 96 | 240 | 312 | 880 | 120 | 108 | |||
| 2016 | 239 | 779 | 320 | 447 | 509 | 421 | 1,004 | 776 | 553 | 504 | 381 | |
| 2017 | 353 | 643 | 322 | 992 | 962 | 364 | 584 | 672 | 846 | 642 | ||
| 2018 | 642 | 182 | 958 | 319 | 320 | 420 | 411 | 334 | 1,161 | 447 | 120 | |
| 2020 | 100 | |||||||||||
| 2022 | 39 | |||||||||||
| 2023 | 38 | |||||||||||
| - = No Data Reported; -- = Not Applicable; NA = Not Available; W = Withheld to avoid disclosure of individual company data. |
| Release Date: 3/29/2024 |
| Next Release Date: 4/30/2024 |