|
Download Data (XLS File) |
|
||||||||
|
||||||||
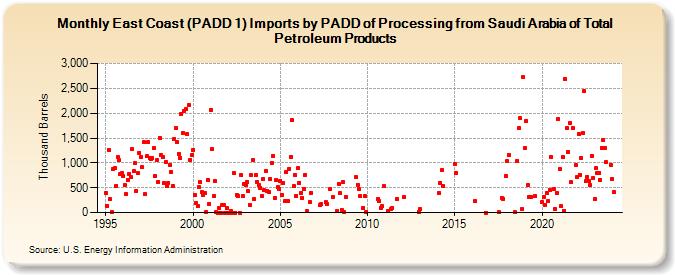
| East Coast (PADD 1) Imports by PADD of Processing from Saudi Arabia of Total Petroleum Products (Thousand Barrels) | ||||||||
| Year | Jan | Feb | Mar | Apr | May | Jun | Jul | Aug | Sep | Oct | Nov | Dec |
|---|---|---|---|---|---|---|---|---|---|---|---|---|
| 1995 | 403 | 135 | 1,252 | 265 | 2 | 876 | 890 | 541 | 1,122 | 1,056 | 770 | 797 |
| 1996 | 731 | 548 | 371 | 650 | 780 | 720 | 1,272 | 836 | 993 | 438 | 789 | 1,206 |
| 1997 | 1,122 | 914 | 1,410 | 365 | 1,130 | 1,416 | 1,089 | 1,085 | 1,090 | 1,297 | 733 | 1,052 |
| 1998 | 625 | 1,504 | 1,163 | 1,123 | 594 | 1,018 | 538 | 595 | 962 | 817 | 540 | 1,489 |
| 1999 | 1,696 | 1,414 | 1,180 | 1,107 | 1,974 | 1,601 | 2,044 | 2,077 | 1,579 | 2,155 | 1,056 | 1,160 |
| 2000 | 1,264 | 356 | 196 | 124 | 505 | 613 | 413 | 345 | 400 | 8 | 659 | 173 |
| 2001 | 2,059 | 1,274 | 326 | 628 | 6 | 0 | 98 | 0 | 147 | 162 | 0 | 95 |
| 2002 | 0 | 0 | 30 | 0 | 797 | 0 | 362 | 341 | 0 | 760 | 327 | 584 |
| 2003 | 550 | 615 | 425 | 161 | 758 | 1,052 | 269 | 752 | 625 | 551 | 501 | 342 |
| 2004 | 681 | 446 | 839 | 432 | 409 | 673 | 1,001 | 1,134 | 301 | 654 | 505 | 466 |
| 2005 | 637 | 360 | 594 | 231 | 812 | 235 | 877 | 1,124 | 1,858 | 526 | 752 | 343 |
| 2006 | 892 | 598 | 391 | 301 | 478 | 762 | 23 | 213 | 399 | |||
| 2007 | 144 | 163 | 207 | 168 | 465 | |||||||
| 2008 | 313 | 33 | 583 | 393 | 54 | 618 | 12 | 314 | ||||
| 2009 | 710 | 563 | 466 | 326 | 95 | 330 | 20 | |||||
| 2010 | 280 | 230 | 100 | 129 | 533 | |||||||
| 2011 | 37 | 67 | 95 | 278 | ||||||||
| 2012 | 311 | 20 | ||||||||||
| 2013 | 66 | |||||||||||
| 2014 | 388 | 598 | 854 | 534 | ||||||||
| 2015 | 973 | 800 | ||||||||||
| 2016 | 227 | 0 | ||||||||||
| 2017 | 3 | 303 | 280 | 737 | ||||||||
| 2018 | 1,034 | 1,161 | 5 | 1,041 | 1,695 | 1,898 | 70 | 2,721 | ||||
| 2019 | 1,299 | 1,847 | 555 | 321 | 319 | 324 | ||||||
| 2020 | 209 | 317 | 161 | 399 | 228 | 461 | 1,110 | 479 | 68 | 398 | 1,883 | |
| 2021 | 883 | 125 | 1,109 | 39 | 2,686 | 1,702 | 1,218 | 1,797 | 606 | 1,697 | 965 | |
| 2022 | 706 | 1,586 | 761 | 1,094 | 1,592 | 2,438 | 626 | 722 | 645 | 556 | 1,147 | 698 |
| 2023 | 269 | 888 | 797 | 802 | 663 | 1,309 | 1,451 | 1,309 | 1,010 | 965 | ||
| 2024 | 679 | 410 | 300 | 517 | 1,219 | 190 | ||||||
| - = No Data Reported; -- = Not Applicable; NA = Not Available; W = Withheld to avoid disclosure of individual company data. |
| Release Date: 8/30/2024 |
| Next Release Date: 9/30/2024 |