|
Download Data (XLS File) |
|
||||||||
|
||||||||
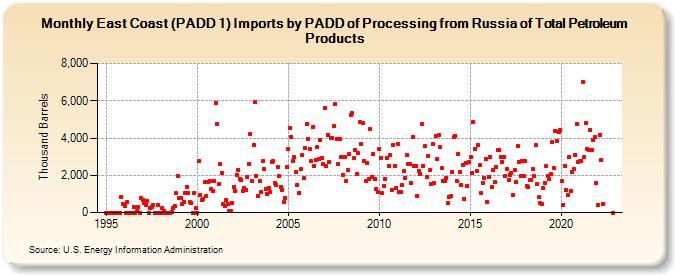
| East Coast (PADD 1) Imports by PADD of Processing from Russia of Total Petroleum Products (Thousand Barrels) | ||||||||
| Year | Jan | Feb | Mar | Apr | May | Jun | Jul | Aug | Sep | Oct | Nov | Dec |
|---|---|---|---|---|---|---|---|---|---|---|---|---|
| 1995 | 0 | 0 | 0 | 0 | 0 | 0 | 0 | 0 | 0 | 0 | 831 | 469 |
| 1996 | 326 | 0 | 556 | 0 | 0 | 0 | 291 | 0 | 65 | 305 | 0 | 797 |
| 1997 | 653 | 519 | 395 | 601 | 0 | 238 | 293 | 417 | 0 | 0 | 422 | 0 |
| 1998 | 0 | 253 | 106 | 3 | 0 | 0 | 0 | 4 | 220 | 328 | 1,033 | 1,966 |
| 1999 | 776 | 792 | 486 | 592 | 1,038 | 1,388 | 1,064 | 544 | 526 | 0 | 1,032 | 256 |
| 2000 | 0 | 2,745 | 961 | 661 | 709 | 1,621 | 896 | 1,631 | 1,680 | 1,254 | 1,165 | 1,710 |
| 2001 | 5,904 | 4,775 | 1,542 | 2,602 | 2,133 | 454 | 354 | 651 | 478 | 59 | 60 | 506 |
| 2002 | 1,366 | 1,179 | 2,017 | 2,301 | 1,816 | 1,757 | 1,156 | 1,311 | 1,192 | 1,911 | 2,601 | 4,229 |
| 2003 | 1,682 | 3,609 | 5,912 | 1,937 | 902 | 1,672 | 1,122 | 2,744 | 2,325 | 1,270 | 985 | 1,324 |
| 2004 | 1,079 | 2,718 | 2,775 | 1,578 | 1,475 | 2,447 | 1,954 | 1,385 | 1,233 | 541 | 761 | 2,429 |
| 2005 | 3,410 | 4,556 | 4,032 | 2,761 | 2,962 | 2,172 | 1,496 | 1,064 | 2,324 | 3,063 | 1,832 | 3,475 |
| 2006 | 4,746 | 3,972 | 3,410 | 2,747 | 4,593 | 2,514 | 2,819 | 3,499 | 2,861 | 3,892 | 2,945 | 2,621 |
| 2007 | 5,623 | 2,498 | 4,188 | 2,699 | 3,999 | 4,013 | 4,659 | 5,826 | 3,931 | 2,594 | 3,932 | 2,995 |
| 2008 | 2,028 | 2,983 | 1,685 | 2,271 | 3,143 | 5,226 | 5,340 | 2,913 | 3,377 | 2,047 | 3,185 | 4,864 |
| 2009 | 3,673 | 4,806 | 2,793 | 1,717 | 2,670 | 1,825 | 4,508 | 1,908 | 3,147 | 1,812 | 1,289 | 1,080 |
| 2010 | 3,420 | 2,942 | 1,034 | 1,449 | 1,816 | 2,946 | 2,490 | 3,078 | 1,208 | 3,640 | 2,507 | 1,319 |
| 2011 | 3,679 | 1,122 | 1,129 | 1,460 | 2,222 | 1,853 | 3,071 | 2,599 | 2,591 | 1,579 | 4,079 | 2,476 |
| 2012 | 2,499 | 868 | 2,243 | 2,051 | 4,738 | 2,524 | 3,567 | 1,912 | 3,042 | 2,280 | 1,547 | 3,659 |
| 2013 | 1,597 | 4,127 | 2,874 | 4,156 | 3,503 | 2,400 | 1,685 | 1,704 | 1,847 | 487 | 856 | 883 |
| 2014 | 2,188 | 4,069 | 4,131 | 1,673 | 3,145 | 2,184 | 1,468 | 2,527 | 709 | 2,677 | 1,444 | 2,692 |
| 2015 | 2,991 | 2,137 | 4,875 | 3,422 | 2,225 | 3,617 | 2,538 | 1,045 | 1,612 | 1,864 | 2,899 | 568 |
| 2016 | 1,912 | 2,983 | 1,370 | 2,282 | 1,642 | 2,421 | 3,340 | 3,352 | 3,000 | 2,709 | 2,958 | 1,961 |
| 2017 | 2,312 | 1,773 | 2,036 | 2,114 | 967 | 2,273 | 1,632 | 3,580 | 2,728 | 1,953 | 2,793 | 1,985 |
| 2018 | 2,744 | 1,441 | 1,364 | 1,732 | 1,734 | 2,330 | 1,942 | 3,634 | 1,533 | 814 | 507 | 450 |
| 2019 | 1,310 | 1,570 | 2,482 | 1,986 | 1,793 | 2,088 | 3,769 | 2,402 | 4,385 | 3,848 | 4,340 | 4,430 |
| 2020 | 1,675 | 432 | 2,515 | 1,202 | 940 | 3,000 | 1,171 | 2,173 | 2,342 | 3,107 | 4,737 | 2,732 |
| 2021 | 2,790 | 2,777 | 7,003 | 3,003 | 4,811 | 3,418 | 3,341 | 4,452 | 3,346 | 3,896 | 4,039 | 1,563 |
| 2022 | 400 | 4,160 | 2,816 | 478 | 0 | |||||||
| - = No Data Reported; -- = Not Applicable; NA = Not Available; W = Withheld to avoid disclosure of individual company data. |
| Release Date: 3/29/2024 |
| Next Release Date: 4/30/2024 |