|
Download Data (XLS File) |
|
||||||||
|
||||||||
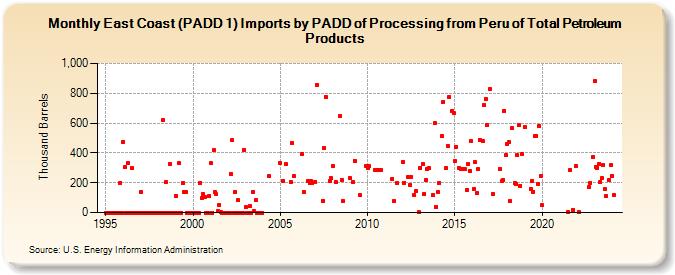
| East Coast (PADD 1) Imports by PADD of Processing from Peru of Total Petroleum Products (Thousand Barrels) | ||||||||
| Year | Jan | Feb | Mar | Apr | May | Jun | Jul | Aug | Sep | Oct | Nov | Dec |
|---|---|---|---|---|---|---|---|---|---|---|---|---|
| 1995 | 0 | 0 | 0 | 0 | 0 | 0 | 0 | 0 | 0 | 0 | 200 | 0 |
| 1996 | 476 | 304 | 0 | 330 | 0 | 0 | 302 | 0 | 0 | 0 | 0 | 0 |
| 1997 | 141 | 0 | 0 | 0 | 0 | 0 | 0 | 0 | 0 | 0 | 0 | 0 |
| 1998 | 0 | 0 | 0 | 620 | 0 | 203 | 0 | 0 | 329 | 0 | 0 | 0 |
| 1999 | 113 | 0 | 332 | 0 | 0 | 200 | 135 | 135 | 0 | 0 | 0 | 0 |
| 2000 | 0 | 0 | 0 | 0 | 0 | 200 | 99 | 125 | 107 | 0 | 0 | 110 |
| 2001 | 330 | 0 | 417 | 135 | 122 | 9 | 51 | 3 | 0 | 0 | 0 | 0 |
| 2002 | 0 | 0 | 260 | 485 | 0 | 140 | 0 | 81 | 0 | 0 | 0 | 418 |
| 2003 | 37 | 0 | 0 | 41 | 0 | 139 | 8 | 81 | 0 | 0 | 0 | 0 |
| 2004 | 242 | |||||||||||
| 2005 | 331 | 211 | 324 | 205 | 466 | 242 | ||||||
| 2006 | 395 | 139 | 210 | 195 | 210 | 198 | ||||||
| 2007 | 208 | 859 | 80 | 433 | 777 | 209 | 230 | |||||
| 2008 | 310 | 206 | 645 | 220 | 79 | |||||||
| 2009 | 229 | 206 | 348 | 116 | 310 | |||||||
| 2010 | 299 | 310 | 285 | 284 | 284 | 285 | 284 | |||||
| 2011 | 224 | 76 | 200 | |||||||||
| 2012 | 338 | 200 | 239 | 187 | 239 | 118 | 142 | 1 | ||||
| 2013 | 300 | 324 | 126 | 217 | 290 | 298 | 118 | 598 | 40 | |||
| 2014 | 138 | 200 | 514 | 744 | 300 | 449 | 776 | 683 | 669 | |||
| 2015 | 348 | 440 | 300 | 290 | 290 | 290 | 289 | 151 | 325 | 280 | 479 | |
| 2016 | 160 | 336 | 129 | 289 | 490 | 480 | 722 | 763 | 589 | |||
| 2017 | 827 | 124 | 295 | 210 | 220 | 684 | 383 | |||||
| 2018 | 459 | 471 | 77 | 567 | 198 | 190 | 383 | 590 | 180 | 393 | ||
| 2019 | 573 | 160 | 213 | 140 | 511 | 515 | 192 | 583 | 247 | |||
| 2020 | 48 | |||||||||||
| 2021 | 6 | 284 | 20 | 311 | ||||||||
| 2022 | 7 | 171 | 200 | 372 | ||||||||
| 2023 | 880 | 307 | 302 | 327 | 208 | 229 | 319 | 157 | 110 | 219 | 319 | |
| 2024 | 247 | |||||||||||
| - = No Data Reported; -- = Not Applicable; NA = Not Available; W = Withheld to avoid disclosure of individual company data. |
| Release Date: 3/29/2024 |
| Next Release Date: 4/30/2024 |