|
Download Data (XLS File) |
|
||||||||
|
||||||||
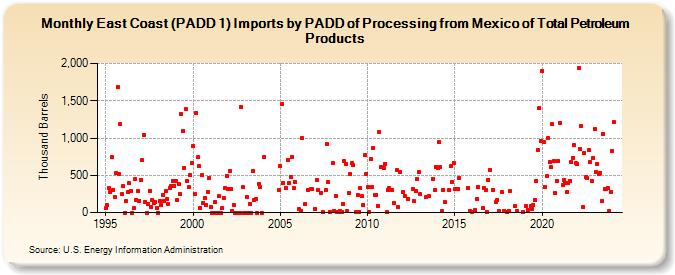
| East Coast (PADD 1) Imports by PADD of Processing from Mexico of Total Petroleum Products (Thousand Barrels) | ||||||||
| Year | Jan | Feb | Mar | Apr | May | Jun | Jul | Aug | Sep | Oct | Nov | Dec |
|---|---|---|---|---|---|---|---|---|---|---|---|---|
| 1995 | 55 | 96 | 328 | 276 | 739 | 309 | 209 | 534 | 1,685 | 520 | 1,183 | 244 |
| 1996 | 350 | 0 | 150 | 272 | 393 | 287 | 0 | 56 | 445 | 169 | 289 | 159 |
| 1997 | 442 | 702 | 1,047 | 147 | 0 | 114 | 295 | 70 | 170 | 126 | 140 | 57 |
| 1998 | 0 | 160 | 107 | 241 | 150 | 286 | 176 | 115 | 333 | 357 | 427 | 360 |
| 1999 | 425 | 169 | 387 | 246 | 1,324 | 1,094 | 602 | 1,384 | 417 | 338 | 500 | 661 |
| 2000 | 893 | 252 | 1,336 | 742 | 624 | 65 | 498 | 134 | 201 | 102 | 279 | 463 |
| 2001 | 75 | 0 | 0 | 142 | 0 | 0 | 216 | 0 | 60 | 192 | 326 | 493 |
| 2002 | 321 | 560 | 321 | 25 | 99 | 0 | 0 | 0 | 0 | 1,416 | 342 | 0 |
| 2003 | 0 | 205 | 0 | 120 | 0 | 556 | 174 | 180 | 0 | 387 | 340 | 0 |
| 2004 | 752 | 300 | ||||||||||
| 2005 | 618 | 1,455 | 401 | 326 | 709 | 401 | 482 | 743 | 332 | 415 | ||
| 2006 | 42 | 27 | 997 | 111 | 304 | 312 | 314 | |||||
| 2007 | 45 | 442 | 302 | 268 | 8 | 301 | 921 | 404 | 12 | |||
| 2008 | 670 | 27 | 225 | 2 | 2 | 22 | 1 | 114 | 687 | 657 | 17 | 268 |
| 2009 | 521 | 660 | 635 | 1 | 234 | 14 | 326 | 218 | 100 | 770 | 522 | |
| 2010 | 339 | 8 | 718 | 345 | 866 | 242 | 239 | 94 | 1,076 | 612 | 615 | 603 |
| 2011 | 658 | 1 | 306 | 325 | 300 | 131 | 568 | 75 | 549 | |||
| 2012 | 270 | 221 | 182 | 320 | 150 | 284 | 451 | 544 | ||||
| 2013 | 245 | 206 | 216 | 456 | 300 | 617 | ||||||
| 2014 | 599 | 944 | 607 | 22 | 301 | 135 | 300 | 619 | 407 | 666 | ||
| 2015 | 315 | 310 | 313 | 458 | 331 | 17 | ||||||
| 2016 | 10 | 29 | 182 | 348 | 62 | 333 | 300 | 8 | 441 | |||
| 2017 | 577 | 303 | 141 | 164 | 16 | 270 | 26 | |||||
| 2018 | 7 | 25 | 284 | 82 | 21 | 2 | ||||||
| 2019 | 87 | 39 | 86 | 45 | 107 | 174 | 424 | 841 | 1,403 | 965 | ||
| 2020 | 1,904 | 942 | 344 | 488 | 994 | 676 | 609 | 1,186 | 698 | 259 | 430 | 689 |
| 2021 | 1,205 | 372 | 443 | 397 | 271 | 403 | 430 | 679 | 733 | 902 | 661 | |
| 2022 | 652 | 1,934 | 850 | 1,156 | 76 | 796 | 475 | 457 | 834 | 675 | 427 | 736 |
| 2023 | 1,120 | 550 | 657 | 517 | 537 | 157 | 1,057 | 315 | 310 | 332 | 22 | 273 |
| 2024 | 820 | |||||||||||
| - = No Data Reported; -- = Not Applicable; NA = Not Available; W = Withheld to avoid disclosure of individual company data. |
| Release Date: 3/29/2024 |
| Next Release Date: 4/30/2024 |