|
Download Data (XLS File) |
|
||||||||
|
||||||||
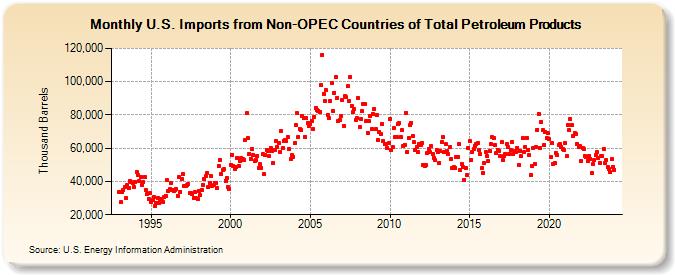
| U.S. Imports from Non-OPEC Countries of Total Petroleum Products (Thousand Barrels) | ||||||||
| Year | Jan | Feb | Mar | Apr | May | Jun | Jul | Aug | Sep | Oct | Nov | Dec |
|---|---|---|---|---|---|---|---|---|---|---|---|---|
| 1993 | 33,719 | 27,476 | 33,633 | 34,610 | 36,418 | 29,905 | 38,062 | 36,225 | 40,326 | 39,548 | 38,903 | 36,836 |
| 1994 | 39,680 | 45,585 | 43,946 | 40,013 | 42,716 | 38,019 | 39,593 | 42,786 | 34,934 | 32,238 | 29,727 | 32,828 |
| 1995 | 27,887 | 29,074 | 30,688 | 25,414 | 26,775 | 30,054 | 27,013 | 29,651 | 28,219 | 27,900 | 30,554 | 31,423 |
| 1996 | 40,676 | 34,259 | 35,448 | 38,877 | 35,124 | 34,116 | 34,708 | 35,465 | 31,410 | 42,474 | 33,954 | 41,682 |
| 1997 | 44,330 | 37,459 | 37,505 | 37,710 | 38,371 | 33,187 | 32,970 | 32,460 | 30,170 | 33,670 | 29,865 | 29,491 |
| 1998 | 34,366 | 31,747 | 34,762 | 38,044 | 41,435 | 43,109 | 44,979 | 36,498 | 39,076 | 43,052 | 37,325 | 37,637 |
| 1999 | 39,151 | 39,353 | 36,188 | 49,536 | 52,927 | 44,227 | 46,685 | 47,235 | 40,458 | 42,086 | 36,638 | 35,461 |
| 2000 | 50,080 | 56,161 | 49,175 | 47,361 | 48,885 | 54,055 | 49,254 | 52,000 | 54,164 | 53,781 | 53,148 | 65,181 |
| 2001 | 81,001 | 65,875 | 56,691 | 53,542 | 59,808 | 55,784 | 52,284 | 53,078 | 55,370 | 48,123 | 50,204 | 48,126 |
| 2002 | 56,261 | 44,327 | 55,868 | 59,013 | 58,019 | 55,069 | 60,193 | 58,111 | 50,880 | 58,777 | 64,140 | 61,000 |
| 2003 | 63,245 | 57,888 | 70,351 | 60,023 | 64,301 | 64,754 | 64,427 | 66,961 | 59,545 | 53,363 | 55,710 | 54,983 |
| 2004 | 63,026 | 74,029 | 80,887 | 66,748 | 71,619 | 70,672 | 79,323 | 78,199 | 66,783 | 77,929 | 75,322 | 73,446 |
| 2005 | 74,299 | 76,594 | 71,448 | 78,817 | 84,361 | 83,008 | 82,535 | 81,936 | 97,756 | 116,202 | 92,753 | 88,287 |
| 2006 | 94,780 | 80,217 | 78,317 | 88,365 | 99,261 | 82,532 | 93,348 | 102,737 | 90,423 | 76,180 | 77,075 | 79,135 |
| 2007 | 89,032 | 73,505 | 91,138 | 90,658 | 97,181 | 88,468 | 102,719 | 85,530 | 81,513 | 83,540 | 76,932 | 78,289 |
| 2008 | 90,123 | 72,706 | 77,548 | 82,501 | 86,524 | 86,585 | 76,114 | 69,046 | 76,121 | 79,175 | 71,427 | 80,850 |
| 2009 | 83,432 | 71,279 | 79,684 | 65,043 | 69,712 | 68,302 | 74,561 | 64,209 | 62,253 | 62,235 | 60,236 | 62,871 |
| 2010 | 77,693 | 58,743 | 60,573 | 71,836 | 66,444 | 66,486 | 74,365 | 75,103 | 66,824 | 70,832 | 61,610 | 62,084 |
| 2011 | 81,327 | 57,723 | 66,060 | 73,668 | 75,239 | 67,529 | 63,534 | 58,685 | 60,522 | 57,496 | 62,647 | 61,846 |
| 2012 | 63,148 | 50,069 | 49,587 | 49,862 | 57,116 | 59,727 | 57,505 | 61,127 | 56,566 | 54,269 | 52,628 | 58,728 |
| 2013 | 57,589 | 51,111 | 58,108 | 63,771 | 66,760 | 58,003 | 62,217 | 58,019 | 56,469 | 60,535 | 53,332 | 48,190 |
| 2014 | 48,460 | 48,336 | 54,784 | 54,699 | 62,461 | 46,611 | 50,394 | 48,522 | 41,054 | 48,271 | 44,114 | 59,930 |
| 2015 | 64,122 | 53,087 | 57,835 | 59,224 | 61,537 | 62,589 | 62,929 | 58,808 | 56,350 | 47,882 | 45,303 | 50,851 |
| 2016 | 57,479 | 55,138 | 52,200 | 58,429 | 62,326 | 66,451 | 66,176 | 61,926 | 56,946 | 59,191 | 58,551 | 55,071 |
| 2017 | 63,662 | 52,855 | 55,237 | 56,714 | 62,424 | 60,531 | 56,698 | 59,126 | 63,568 | 56,336 | 58,540 | 57,489 |
| 2018 | 60,388 | 49,845 | 58,299 | 55,005 | 65,970 | 57,864 | 60,620 | 66,301 | 59,184 | 55,665 | 43,872 | 49,317 |
| 2019 | 59,852 | 50,463 | 60,810 | 71,147 | 80,616 | 60,149 | 75,969 | 70,775 | 61,917 | 69,878 | 65,969 | 69,128 |
| 2020 | 65,590 | 54,469 | 63,259 | 50,663 | 51,284 | 57,198 | 55,996 | 61,770 | 62,271 | 60,903 | 59,591 | 58,736 |
| 2021 | 63,212 | 55,142 | 73,885 | 70,680 | 77,529 | 73,740 | 67,066 | 68,911 | 68,450 | 62,549 | 60,496 | 61,030 |
| 2022 | 52,092 | 60,012 | 59,391 | 55,218 | 54,730 | 52,549 | 55,339 | 53,791 | 44,956 | 50,448 | 52,802 | 55,708 |
| 2023 | 57,432 | 53,818 | 51,353 | 55,102 | 55,278 | 59,748 | 51,022 | 52,655 | 48,609 | 47,494 | 45,527 | 53,220 |
| 2024 | 48,963 | |||||||||||
| - = No Data Reported; -- = Not Applicable; NA = Not Available; W = Withheld to avoid disclosure of individual company data. |
| Release Date: 3/29/2024 |
| Next Release Date: 4/30/2024 |