|
Download Data (XLS File) |
|
||||||||
|
||||||||
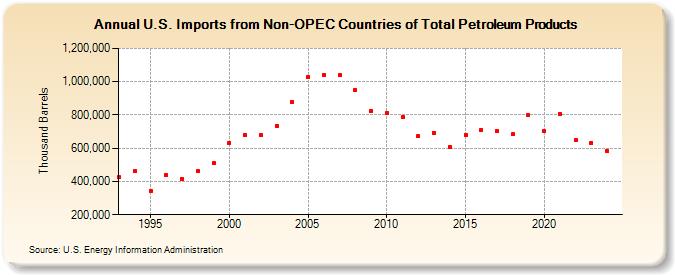
| U.S. Imports from Non-OPEC Countries of Total Petroleum Products (Thousand Barrels) | ||||||||
| Decade | Year-0 | Year-1 | Year-2 | Year-3 | Year-4 | Year-5 | Year-6 | Year-7 | Year-8 | Year-9 |
|---|---|---|---|---|---|---|---|---|---|---|
| 1990's | 425,661 | 462,065 | 344,652 | 438,193 | 417,188 | 462,030 | 509,945 | |||
| 2000's | 633,245 | 679,886 | 681,658 | 735,551 | 877,983 | 1,027,996 | 1,042,370 | 1,038,505 | 948,720 | 823,817 |
| 2010's | 812,593 | 786,276 | 670,332 | 694,104 | 607,636 | 680,517 | 709,884 | 703,180 | 682,330 | 796,673 |
| 2020's | 701,730 | 802,690 | 647,036 | 631,258 |
| - = No Data Reported; -- = Not Applicable; NA = Not Available; W = Withheld to avoid disclosure of individual company data. |
| Release Date: 3/29/2024 |
| Next Release Date: 8/30/2024 |