|
Download Data (XLS File) |
|
||||||||
|
||||||||
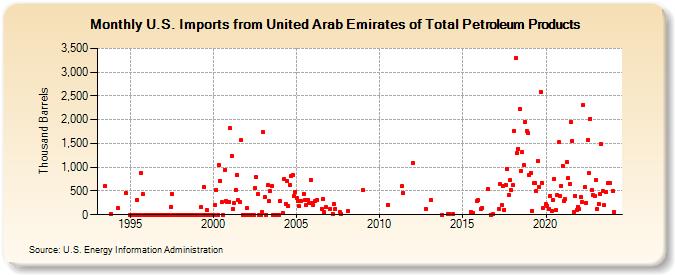
| U.S. Imports from United Arab Emirates of Total Petroleum Products (Thousand Barrels) | ||||||||
| Year | Jan | Feb | Mar | Apr | May | Jun | Jul | Aug | Sep | Oct | Nov | Dec |
|---|---|---|---|---|---|---|---|---|---|---|---|---|
| 1993 | 603 | 20 | ||||||||||
| 1994 | 131 | 448 | ||||||||||
| 1995 | 0 | 0 | 0 | 0 | 0 | 317 | 0 | 0 | 882 | 430 | 0 | 0 |
| 1996 | 0 | 0 | 0 | 0 | 0 | 0 | 0 | 0 | 0 | 0 | 0 | 0 |
| 1997 | 0 | 0 | 0 | 0 | 0 | 171 | 445 | 0 | 0 | 0 | 0 | 0 |
| 1998 | 0 | 0 | 0 | 0 | 0 | 0 | 0 | 0 | 0 | 0 | 0 | 0 |
| 1999 | 0 | 0 | 0 | 163 | 0 | 583 | 0 | 96 | 0 | 0 | 0 | 0 |
| 2000 | 0 | 211 | 528 | 0 | 1,039 | 715 | 270 | 0 | 943 | 284 | 275 | 275 |
| 2001 | 1,816 | 1,237 | 125 | 238 | 524 | 832 | 307 | 270 | 1,567 | 0 | 0 | 0 |
| 2002 | 150 | 0 | 0 | 0 | 0 | 0 | 564 | 788 | 433 | 0 | 0 | 67 |
| 2003 | 1,733 | 366 | 0 | 618 | 279 | 490 | 600 | 0 | 0 | 0 | 0 | 0 |
| 2004 | 286 | 40 | 754 | 230 | 716 | 181 | 634 | 819 | 838 | 403 | 478 | |
| 2005 | 356 | 285 | 173 | 284 | 445 | 313 | 206 | 310 | 250 | 738 | 250 | |
| 2006 | 210 | 284 | 314 | 124 | 337 | 47 | 157 | |||||
| 2007 | 128 | 22 | 221 | 129 | 67 | 22 | ||||||
| 2008 | 74 | |||||||||||
| 2009 | 520 | |||||||||||
| 2010 | 210 | |||||||||||
| 2011 | 594 | 454 | ||||||||||
| 2012 | 1,094 | 123 | ||||||||||
| 2013 | 312 | 2 | ||||||||||
| 2014 | 16 | 10 | 20 | |||||||||
| 2015 | 67 | 43 | 284 | 309 | ||||||||
| 2016 | 111 | 151 | 531 | 1 | 11 | |||||||
| 2017 | 128 | 639 | 195 | 597 | 108 | 635 | 964 | 418 | 725 | 517 | ||
| 2018 | 620 | 1,771 | 3,303 | 1,294 | 1,387 | 2,221 | 915 | 1,319 | 1,046 | 1,960 | 1,771 | 1,710 |
| 2019 | 829 | 885 | 88 | 664 | 677 | 492 | 1,131 | 589 | 2,589 | 673 | 141 | |
| 2020 | 216 | 185 | 115 | 397 | 77 | 313 | 759 | 89 | 410 | 1,521 | 395 | 614 |
| 2021 | 1,033 | 293 | 325 | 1,109 | 770 | 644 | 1,944 | 1,552 | 62 | 402 | 95 | 172 |
| 2022 | 121 | 381 | 263 | 2,312 | 578 | 257 | 1,567 | 869 | 2,021 | 521 | 410 | 390 |
| 2023 | 721 | 123 | 235 | 442 | 1,478 | 500 | 194 | 470 | 677 | 672 | ||
| 2024 | 499 | |||||||||||
| - = No Data Reported; -- = Not Applicable; NA = Not Available; W = Withheld to avoid disclosure of individual company data. |
| Release Date: 3/29/2024 |
| Next Release Date: 4/30/2024 |