|
Download Data (XLS File) |
|
||||||||
|
||||||||
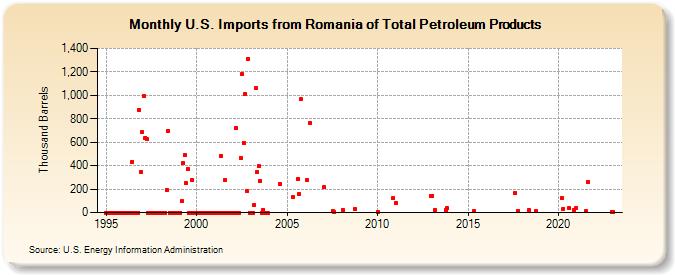
| U.S. Imports from Romania of Total Petroleum Products (Thousand Barrels) | ||||||||
| Year | Jan | Feb | Mar | Apr | May | Jun | Jul | Aug | Sep | Oct | Nov | Dec |
|---|---|---|---|---|---|---|---|---|---|---|---|---|
| 1995 | 0 | 0 | 0 | 0 | 0 | 0 | 0 | 0 | 0 | 0 | 0 | 0 |
| 1996 | 0 | 0 | 0 | 0 | 0 | 432 | 0 | 0 | 0 | 0 | 874 | 346 |
| 1997 | 683 | 996 | 640 | 625 | 0 | 0 | 0 | 0 | 0 | 0 | 0 | 0 |
| 1998 | 0 | 0 | 0 | 0 | 196 | 697 | 0 | 0 | 0 | 0 | 0 | 0 |
| 1999 | 0 | 0 | 98 | 420 | 488 | 252 | 373 | 0 | 0 | 276 | 0 | 0 |
| 2000 | 0 | 0 | 0 | 0 | 0 | 0 | 0 | 0 | 0 | 0 | 0 | 0 |
| 2001 | 0 | 0 | 0 | 0 | 486 | 0 | 0 | 276 | 0 | 0 | 0 | 0 |
| 2002 | 0 | 0 | 722 | 0 | 0 | 467 | 1,180 | 590 | 1,012 | 182 | 1,311 | 0 |
| 2003 | 0 | 0 | 63 | 1,061 | 342 | 396 | 270 | 0 | 25 | 0 | 0 | 0 |
| 2004 | 245 | |||||||||||
| 2005 | 129 | 288 | 157 | 965 | ||||||||
| 2006 | 275 | 765 | ||||||||||
| 2007 | 215 | 16 | 8 | |||||||||
| 2008 | 21 | 28 | ||||||||||
| 2010 | 6 | 124 | ||||||||||
| 2011 | 83 | |||||||||||
| 2012 | 140 | |||||||||||
| 2013 | 144 | 22 | 22 | 36 | ||||||||
| 2015 | 15 | |||||||||||
| 2017 | 166 | 16 | ||||||||||
| 2018 | 20 | 10 | ||||||||||
| 2020 | 124 | 33 | 35 | 26 | 36 | |||||||
| 2021 | 11 | 261 | ||||||||||
| 2022 | 9 | |||||||||||
| 2023 | 7 | |||||||||||
| - = No Data Reported; -- = Not Applicable; NA = Not Available; W = Withheld to avoid disclosure of individual company data. |
| Release Date: 3/29/2024 |
| Next Release Date: 4/30/2024 |
Referring Pages: