|
Download Data (XLS File) |
|
||||||||
|
||||||||
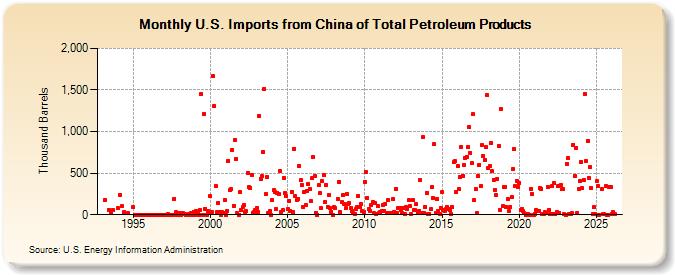
| U.S. Imports from China of Total Petroleum Products (Thousand Barrels) | ||||||||
| Year | Jan | Feb | Mar | Apr | May | Jun | Jul | Aug | Sep | Oct | Nov | Dec |
|---|---|---|---|---|---|---|---|---|---|---|---|---|
| 1993 | 177 | 62 | 22 | 56 | ||||||||
| 1994 | 80 | 241 | 99 | 34 | 15 | |||||||
| 1995 | 89 | 0 | 0 | 0 | 0 | 0 | 0 | 0 | 0 | 0 | 0 | 0 |
| 1996 | 0 | 0 | 0 | 0 | 0 | 0 | 0 | 0 | 0 | 0 | 0 | 0 |
| 1997 | 0 | 0 | 0 | 10 | 0 | 0 | 0 | 0 | 192 | 30 | 0 | 0 |
| 1998 | 25 | 0 | 12 | 15 | 8 | 0 | 0 | 13 | 0 | 19 | 0 | 37 |
| 1999 | 1 | 46 | 31 | 0 | 55 | 1,450 | 0 | 1,213 | 74 | 0 | 44 | 22 |
| 2000 | 222 | 27 | 1,666 | 1,308 | 344 | 28 | 145 | 34 | 0 | 28 | 25 | 177 |
| 2001 | 1 | 47 | 650 | 293 | 305 | 784 | 109 | 902 | 669 | 16 | 0 | 275 |
| 2002 | 56 | 92 | 114 | 28 | 39 | 506 | 336 | 322 | 483 | 26 | 29 | 60 |
| 2003 | 84 | 31 | 1,189 | 435 | 460 | 759 | 1,516 | 249 | 449 | 15 | 42 | 0 |
| 2004 | 179 | 296 | 269 | 66 | 264 | 250 | 527 | 35 | 56 | 440 | 262 | 221 |
| 2005 | 64 | 165 | 46 | 278 | 38 | 794 | 225 | 180 | 193 | 584 | 413 | 363 |
| 2006 | 91 | 271 | 116 | 287 | 371 | 309 | 161 | 438 | 688 | 462 | 23 | 1 |
| 2007 | 353 | 259 | 76 | 401 | 475 | 151 | 358 | 96 | 239 | 83 | 38 | 2 |
| 2008 | 87 | 83 | 186 | 399 | 31 | 147 | 233 | 127 | 76 | 244 | 130 | |
| 2009 | 135 | 80 | 47 | 18 | 11 | 68 | 90 | 227 | 87 | 127 | 40 | 38 |
| 2010 | 398 | 513 | 206 | 74 | 42 | 114 | 150 | 16 | 136 | 3 | 101 | 22 |
| 2011 | 29 | 45 | 117 | 45 | 131 | 24 | 176 | 22 | 26 | 15 | 186 | 37 |
| 2012 | 313 | 18 | 81 | 83 | 53 | 17 | 86 | 5 | 90 | 74 | 171 | 106 |
| 2013 | 7 | 180 | 59 | 52 | 124 | 22 | 46 | 414 | 19 | 933 | 19 | 93 |
| 2014 | 266 | 9 | 14 | 65 | 328 | 206 | 847 | 20 | 190 | 45 | 14 | 84 |
| 2015 | 270 | 55 | 47 | 68 | 92 | 66 | 51 | 5 | 90 | 628 | 641 | 274 |
| 2016 | 586 | 315 | 457 | 818 | 469 | 601 | 684 | 700 | 814 | 1,050 | 745 | 616 |
| 2017 | 1,207 | 173 | 312 | 21 | 469 | 599 | 345 | 837 | 706 | 658 | 813 | 1,437 |
| 2018 | 564 | 584 | 862 | 520 | 418 | 303 | 232 | 434 | 828 | 55 | 1,268 | 101 |
| 2019 | 333 | 337 | 87 | 190 | 41 | 90 | 213 | 549 | 789 | 348 | 407 | 338 |
| 2020 | 383 | 52 | 73 | 40 | 21 | 1 | 5 | 9 | 1 | 313 | 248 | 2 |
| 2021 | 3 | 57 | 45 | 47 | 316 | 308 | 3 | 4 | 27 | 25 | 334 | 60 |
| 2022 | 3 | 340 | 3 | 380 | 3 | 36 | 340 | 24 | 356 | 307 | 311 | 5 |
| 2023 | 2 | 611 | 681 | 5 | 7 | 20 | 842 | 465 | 803 | 26 | 308 | 404 |
| 2024 | 631 | |||||||||||
| - = No Data Reported; -- = Not Applicable; NA = Not Available; W = Withheld to avoid disclosure of individual company data. |
| Release Date: 3/29/2024 |
| Next Release Date: 4/30/2024 |
Referring Pages: