|
Download Data (XLS File) |
|
||||||||
|
||||||||
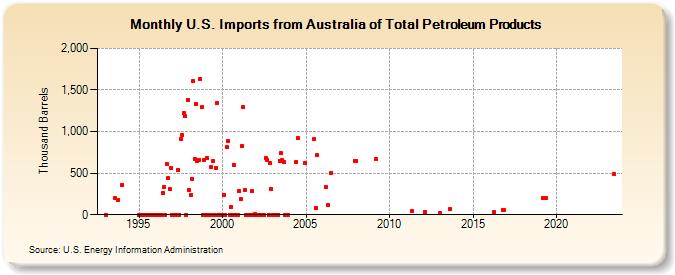
| U.S. Imports from Australia of Total Petroleum Products (Thousand Barrels) | ||||||||
| Year | Jan | Feb | Mar | Apr | May | Jun | Jul | Aug | Sep | Oct | Nov | Dec |
|---|---|---|---|---|---|---|---|---|---|---|---|---|
| 1993 | 1 | 196 | 182 | |||||||||
| 1994 | 362 | |||||||||||
| 1995 | 0 | 1 | 0 | 0 | 0 | 0 | 0 | 0 | 0 | 0 | 1 | 0 |
| 1996 | 0 | 0 | 0 | 0 | 0 | 265 | 337 | 0 | 610 | 440 | 305 | 567 |
| 1997 | 0 | 0 | 0 | 0 | 543 | 0 | 916 | 964 | 1,225 | 1,186 | 0 | 1,382 |
| 1998 | 295 | 235 | 432 | 1,606 | 674 | 1,332 | 648 | 658 | 1,636 | 1,291 | 0 | 659 |
| 1999 | 0 | 680 | 0 | 0 | 571 | 648 | 0 | 563 | 1,344 | 0 | 0 | 0 |
| 2000 | 0 | 241 | 0 | 812 | 886 | 0 | 90 | 0 | 600 | 0 | 0 | 0 |
| 2001 | 284 | 184 | 831 | 1,298 | 302 | 0 | 0 | 0 | 0 | 281 | 0 | 3 |
| 2002 | 0 | 0 | 0 | 0 | 0 | 0 | 0 | 680 | 654 | 0 | 618 | 307 |
| 2003 | 0 | 0 | 0 | 0 | 0 | 651 | 739 | 657 | 629 | 0 | 0 | 0 |
| 2004 | 631 | 925 | 618 | |||||||||
| 2005 | 907 | 84 | 715 | |||||||||
| 2006 | 338 | 115 | 502 | |||||||||
| 2007 | 650 | |||||||||||
| 2008 | 651 | |||||||||||
| 2009 | 667 | |||||||||||
| 2011 | 43 | |||||||||||
| 2012 | 28 | |||||||||||
| 2013 | 17 | 66 | ||||||||||
| 2016 | 30 | 59 | 58 | |||||||||
| 2019 | 202 | 196 | ||||||||||
| 2023 | 492 | |||||||||||
| - = No Data Reported; -- = Not Applicable; NA = Not Available; W = Withheld to avoid disclosure of individual company data. |
| Release Date: 3/29/2024 |
| Next Release Date: 4/30/2024 |