|
Download Data (XLS File) |
|
||||||||
|
||||||||
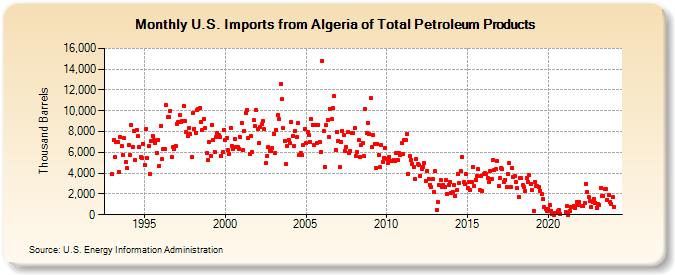
| U.S. Imports from Algeria of Total Petroleum Products (Thousand Barrels) | ||||||||
| Year | Jan | Feb | Mar | Apr | May | Jun | Jul | Aug | Sep | Oct | Nov | Dec |
|---|---|---|---|---|---|---|---|---|---|---|---|---|
| 1993 | 3,873 | 7,178 | 5,525 | 6,976 | 6,976 | 4,109 | 7,454 | 6,595 | 5,746 | 7,354 | 5,118 | 4,468 |
| 1994 | 6,698 | 5,757 | 8,629 | 6,476 | 8,101 | 5,280 | 8,157 | 7,536 | 6,519 | 5,537 | 5,496 | 6,844 |
| 1995 | 4,751 | 8,234 | 5,477 | 6,601 | 3,938 | 7,115 | 7,600 | 7,214 | 6,916 | 5,897 | 7,230 | 4,713 |
| 1996 | 8,535 | 5,328 | 6,280 | 6,281 | 10,525 | 9,394 | 9,440 | 10,006 | 5,573 | 6,484 | 6,328 | 6,624 |
| 1997 | 8,738 | 8,937 | 9,566 | 8,907 | 8,990 | 10,467 | 9,035 | 7,957 | 7,588 | 8,334 | 7,807 | 5,567 |
| 1998 | 9,789 | 8,270 | 7,895 | 10,065 | 10,215 | 10,240 | 8,938 | 8,187 | 9,185 | 8,300 | 5,891 | 5,228 |
| 1999 | 7,025 | 5,687 | 8,675 | 7,209 | 6,071 | 7,462 | 7,854 | 7,713 | 7,523 | 5,674 | 5,996 | 8,179 |
| 2000 | 7,230 | 7,424 | 6,178 | 5,837 | 8,383 | 6,652 | 6,347 | 7,304 | 6,489 | 6,500 | 6,345 | 7,445 |
| 2001 | 8,851 | 6,232 | 8,060 | 9,788 | 10,089 | 7,347 | 5,875 | 7,546 | 6,003 | 9,072 | 8,497 | 10,114 |
| 2002 | 8,210 | 6,945 | 8,440 | 8,680 | 9,007 | 8,206 | 4,959 | 5,662 | 6,498 | 6,175 | 6,166 | 6,376 |
| 2003 | 7,800 | 5,955 | 8,171 | 9,564 | 9,171 | 12,529 | 11,093 | 8,294 | 7,083 | 4,896 | 6,597 | 7,188 |
| 2004 | 6,864 | 8,948 | 7,547 | 6,580 | 8,091 | 7,429 | 8,804 | 5,733 | 5,931 | 5,737 | 6,736 | 8,227 |
| 2005 | 6,854 | 7,970 | 7,639 | 7,042 | 9,217 | 8,658 | 6,667 | 8,676 | 6,882 | 8,663 | 7,026 | 5,999 |
| 2006 | 14,804 | 8,089 | 4,586 | 8,603 | 9,099 | 7,482 | 10,204 | 9,200 | 10,288 | 11,419 | 6,272 | 7,932 |
| 2007 | 7,124 | 4,553 | 7,000 | 8,061 | 7,671 | 6,158 | 6,514 | 7,914 | 5,977 | 6,130 | 7,907 | 7,826 |
| 2008 | 8,369 | 5,606 | 6,028 | 7,149 | 5,581 | 6,692 | 6,931 | 5,619 | 10,141 | 7,850 | 8,854 | 7,720 |
| 2009 | 11,182 | 6,511 | 7,666 | 6,836 | 4,512 | 6,787 | 5,786 | 4,561 | 6,660 | 5,079 | 5,432 | 6,447 |
| 2010 | 5,322 | 4,993 | 5,551 | 5,172 | 5,154 | 5,257 | 5,125 | 5,932 | 5,298 | 5,953 | 5,789 | 6,894 |
| 2011 | 5,816 | 7,168 | 7,192 | 7,791 | 3,963 | 5,611 | 5,280 | 4,925 | 4,558 | 3,400 | 5,356 | 4,847 |
| 2012 | 4,825 | 3,772 | 4,364 | 4,636 | 4,968 | 3,273 | 4,235 | 3,457 | 2,880 | 2,647 | 3,409 | 2,230 |
| 2013 | 4,183 | 487 | 1,229 | 2,848 | 3,310 | 2,625 | 2,867 | 2,635 | 3,292 | 2,036 | 2,899 | 3,142 |
| 2014 | 2,119 | 2,208 | 2,858 | 1,817 | 2,354 | 3,958 | 3,058 | 4,249 | 5,553 | 3,119 | 2,934 | 3,875 |
| 2015 | 2,550 | 3,145 | 2,352 | 3,192 | 4,636 | 2,724 | 3,374 | 3,751 | 4,364 | 2,341 | 3,707 | 2,282 |
| 2016 | 3,896 | 3,978 | 3,954 | 3,514 | 3,161 | 4,234 | 3,477 | 5,240 | 4,291 | 4,366 | 5,121 | 2,797 |
| 2017 | 3,555 | 4,458 | 4,368 | 3,143 | 3,375 | 2,678 | 3,928 | 4,993 | 2,686 | 4,452 | 3,613 | 3,680 |
| 2018 | 3,136 | 2,540 | 1,728 | 3,523 | 3,535 | 2,825 | 2,639 | 2,273 | 3,510 | 3,161 | 3,819 | 2,998 |
| 2019 | 2,400 | 390 | 3,186 | 2,716 | 2,737 | 2,674 | 2,310 | 1,957 | 1,474 | 723 | 568 | 353 |
| 2020 | 529 | 964 | 367 | 24 | 16 | 209 | 133 | 328 | 412 | 80 | ||
| 2021 | 266 | 824 | 15 | 385 | 766 | 777 | 826 | 653 | 1,213 | 931 | 1,220 | |
| 2022 | 806 | 885 | 1,152 | 2,986 | 2,209 | 1,709 | 1,280 | 776 | 1,187 | 1,539 | 1,171 | |
| 2023 | 639 | 1,074 | 960 | 2,579 | 1,769 | 1,841 | 2,462 | 2,426 | 1,458 | 1,924 | 1,213 | 1,003 |
| 2024 | 1,719 | |||||||||||
| - = No Data Reported; -- = Not Applicable; NA = Not Available; W = Withheld to avoid disclosure of individual company data. |
| Release Date: 3/29/2024 |
| Next Release Date: 4/30/2024 |
Referring Pages: