|
Download Data (XLS File) |
|
||||||||
|
||||||||
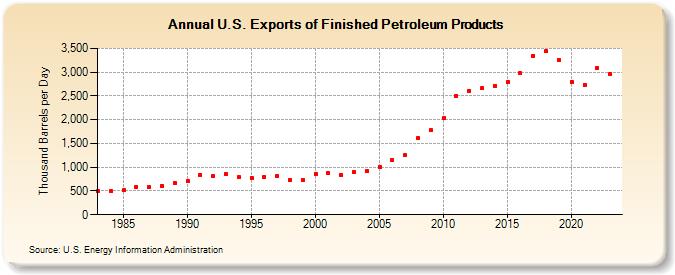
| U.S. Exports of Finished Petroleum Products (Thousand Barrels per Day) | ||||||||
| Decade | Year-0 | Year-1 | Year-2 | Year-3 | Year-4 | Year-5 | Year-6 | Year-7 | Year-8 | Year-9 |
|---|---|---|---|---|---|---|---|---|---|---|
| 1980's | 502 | 490 | 513 | 586 | 573 | 610 | 676 | |||
| 1990's | 707 | 843 | 811 | 853 | 788 | 782 | 796 | 813 | 734 | 729 |
| 2000's | 863 | 869 | 842 | 897 | 913 | 1,010 | 1,144 | 1,247 | 1,608 | 1,777 |
| 2010's | 2,025 | 2,503 | 2,609 | 2,660 | 2,717 | 2,793 | 2,972 | 3,344 | 3,439 | 3,252 |
| 2020's | 2,802 | 2,731 | 3,087 | 2,968 |
| - = No Data Reported; -- = Not Applicable; NA = Not Available; W = Withheld to avoid disclosure of individual company data. |
| Release Date: 3/29/2024 |
| Next Release Date: 8/30/2024 |