|
Download Data (XLS File) |
|
||||||||
|
||||||||
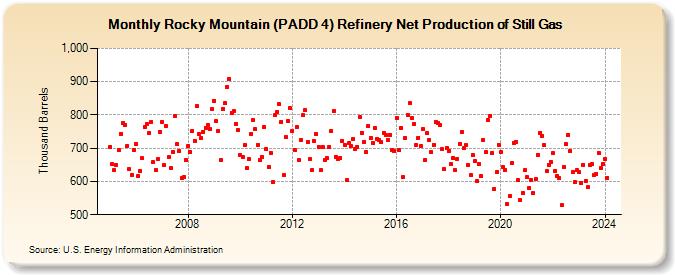
| Rocky Mountain (PADD 4) Refinery Net Production of Still Gas (Thousand Barrels) | ||||||||
| Year | Jan | Feb | Mar | Apr | May | Jun | Jul | Aug | Sep | Oct | Nov | Dec |
|---|---|---|---|---|---|---|---|---|---|---|---|---|
| 2005 | 705 | 651 | 634 | 649 | 694 | 744 | 775 | 769 | 707 | 636 | 620 | 696 |
| 2006 | 713 | 616 | 631 | 669 | 764 | 773 | 746 | 779 | 657 | 633 | 667 | 749 |
| 2007 | 779 | 649 | 767 | 672 | 639 | 690 | 797 | 712 | 691 | 611 | 613 | 664 |
| 2008 | 707 | 690 | 752 | 723 | 826 | 742 | 730 | 750 | 761 | 770 | 758 | 817 |
| 2009 | 843 | 781 | 753 | 664 | 819 | 835 | 885 | 908 | 807 | 811 | 774 | 754 |
| 2010 | 679 | 674 | 709 | 641 | 666 | 744 | 785 | 757 | 711 | 664 | 674 | 763 |
| 2011 | 698 | 644 | 687 | 597 | 800 | 809 | 832 | 780 | 618 | 733 | 781 | 820 |
| 2012 | 752 | 694 | 763 | 663 | 725 | 799 | 814 | 719 | 667 | 634 | 721 | 743 |
| 2013 | 703 | 633 | 704 | 664 | 669 | 704 | 752 | 812 | 675 | 667 | 671 | 723 |
| 2014 | 710 | 603 | 715 | 707 | 727 | 698 | 705 | 794 | 747 | 718 | 690 | 767 |
| 2015 | 732 | 716 | 762 | 728 | 726 | 718 | 747 | 741 | 725 | 740 | 694 | 691 |
| 2016 | 791 | 694 | 762 | 612 | 732 | 800 | 835 | 790 | 773 | 709 | 732 | 707 |
| 2017 | 757 | 664 | 746 | 726 | 689 | 711 | 780 | 777 | 770 | 697 | 636 | 700 |
| 2018 | 692 | 653 | 670 | 634 | 668 | 714 | 750 | 700 | 710 | 649 | 618 | 679 |
| 2019 | 662 | 600 | 652 | 615 | 724 | 688 | 784 | 796 | 686 | 577 | 627 | 711 |
| 2020 | 688 | 642 | 635 | 531 | 556 | 655 | 716 | 720 | 603 | 543 | 565 | 633 |
| 2021 | 612 | 580 | 605 | 564 | 606 | 681 | 747 | 738 | 710 | 631 | 650 | 659 |
| 2022 | 685 | 632 | 616 | 610 | 528 | 644 | 712 | 740 | 691 | 628 | 597 | 633 |
| 2023 | 627 | 596 | 650 | 601 | 582 | 648 | 652 | 618 | 623 | 686 | 639 | 651 |
| 2024 | 667 | |||||||||||
| - = No Data Reported; -- = Not Applicable; NA = Not Available; W = Withheld to avoid disclosure of individual company data. |
| Release Date: 3/29/2024 |
| Next Release Date: 4/30/2024 |
Referring Pages: