|
Download Data (XLS File) |
|
||||||||
|
||||||||
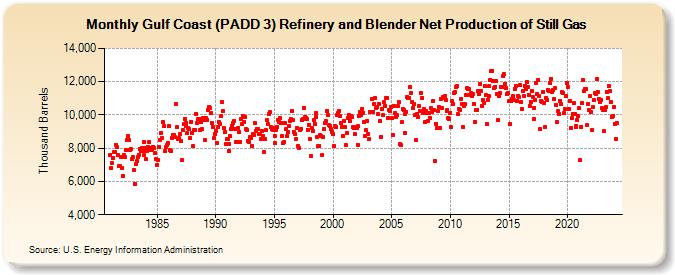
| Gulf Coast (PADD 3) Refinery and Blender Net Production of Still Gas (Thousand Barrels) | ||||||||
| Year | Jan | Feb | Mar | Apr | May | Jun | Jul | Aug | Sep | Oct | Nov | Dec |
|---|---|---|---|---|---|---|---|---|---|---|---|---|
| 1981 | 7,609 | 6,825 | 7,117 | 7,410 | 7,767 | 7,765 | 8,216 | 8,043 | 7,565 | 6,909 | 6,931 | 7,463 |
| 1982 | 6,803 | 6,320 | 7,582 | 7,440 | 7,914 | 8,466 | 8,722 | 8,473 | 7,912 | 7,935 | 7,326 | 7,449 |
| 1983 | 6,706 | 5,866 | 7,076 | 7,207 | 7,488 | 7,615 | 7,963 | 7,812 | 7,985 | 7,820 | 8,366 | 7,563 |
| 1984 | 8,029 | 7,325 | 7,853 | 8,099 | 8,358 | 8,020 | 7,884 | 7,898 | 8,101 | 8,025 | 7,723 | 7,323 |
| 1985 | 6,995 | 7,287 | 8,087 | 8,510 | 8,918 | 8,611 | 9,552 | 9,313 | 7,860 | 8,072 | 8,164 | 8,294 |
| 1986 | 9,330 | 7,863 | 7,814 | 8,634 | 8,812 | 8,808 | 8,653 | 10,634 | 9,244 | 8,533 | 8,592 | 8,842 |
| 1987 | 8,413 | 7,298 | 9,089 | 9,428 | 9,759 | 9,320 | 9,524 | 8,916 | 9,201 | 9,153 | 8,623 | 9,591 |
| 1988 | 8,899 | 8,111 | 9,116 | 9,116 | 10,071 | 9,496 | 9,749 | 9,780 | 9,104 | 9,547 | 9,160 | 9,804 |
| 1989 | 9,678 | 8,464 | 9,789 | 9,712 | 10,314 | 10,487 | 10,436 | 10,092 | 9,504 | 9,302 | 8,596 | 8,882 |
| 1990 | 9,037 | 8,309 | 9,245 | 9,571 | 9,454 | 9,918 | 10,787 | 10,228 | 9,229 | 8,960 | 8,260 | 8,527 |
| 1991 | 8,523 | 7,819 | 8,274 | 8,719 | 9,160 | 9,325 | 9,494 | 9,645 | 9,146 | 8,376 | 8,399 | 9,233 |
| 1992 | 8,987 | 8,401 | 9,766 | 9,455 | 9,941 | 9,601 | 9,889 | 9,143 | 9,098 | 8,429 | 8,401 | 8,680 |
| 1993 | 8,636 | 8,110 | 8,831 | 8,817 | 9,490 | 9,040 | 9,170 | 9,141 | 8,864 | 8,873 | 8,533 | 9,060 |
| 1994 | 8,711 | 7,785 | 8,548 | 9,077 | 9,676 | 9,444 | 10,039 | 10,147 | 9,258 | 9,130 | 9,111 | 9,188 |
| 1995 | 8,756 | 8,284 | 9,099 | 9,268 | 9,681 | 9,570 | 9,810 | 9,505 | 8,751 | 8,305 | 8,347 | 9,518 |
| 1996 | 9,147 | 8,720 | 8,988 | 9,307 | 9,658 | 9,775 | 10,226 | 9,690 | 8,959 | 8,854 | 8,572 | 9,227 |
| 1997 | 8,143 | 7,983 | 9,072 | 9,131 | 9,697 | 9,744 | 10,444 | 9,866 | 9,803 | 9,725 | 9,109 | 9,401 |
| 1998 | 8,576 | 7,529 | 9,187 | 9,045 | 9,679 | 9,471 | 10,125 | 9,847 | 8,662 | 8,118 | 8,147 | 8,779 |
| 1999 | 8,731 | 7,568 | 8,669 | 9,167 | 9,506 | 9,617 | 10,248 | 9,991 | 9,374 | 9,333 | 9,137 | 8,983 |
| 2000 | 8,829 | 8,126 | 9,308 | 9,256 | 9,989 | 10,132 | 10,229 | 9,909 | 9,522 | 9,287 | 8,742 | 9,638 |
| 2001 | 9,252 | 8,189 | 8,902 | 9,808 | 10,000 | 9,644 | 9,942 | 9,890 | 9,249 | 9,214 | 8,882 | 9,275 |
| 2002 | 9,230 | 8,211 | 9,304 | 9,943 | 10,167 | 9,997 | 10,385 | 10,138 | 9,556 | 8,745 | 9,073 | 9,634 |
| 2003 | 8,853 | 8,528 | 10,179 | 10,197 | 10,982 | 10,179 | 10,656 | 10,989 | 10,393 | 10,452 | 10,080 | 10,680 |
| 2004 | 9,636 | 8,662 | 10,351 | 9,987 | 10,752 | 10,566 | 11,021 | 11,029 | 9,829 | 10,298 | 10,206 | 10,489 |
| 2005 | 9,786 | 8,819 | 10,538 | 10,124 | 9,899 | 9,975 | 10,523 | 10,782 | 8,267 | 8,175 | 9,549 | 10,362 |
| 2006 | 10,285 | 8,935 | 10,046 | 10,192 | 11,089 | 11,004 | 10,999 | 11,677 | 11,326 | 10,777 | 10,446 | 10,669 |
| 2007 | 9,978 | 8,488 | 10,061 | 9,889 | 10,519 | 10,246 | 11,338 | 11,035 | 10,138 | 10,332 | 9,564 | 10,224 |
| 2008 | 10,122 | 9,649 | 10,115 | 9,808 | 10,442 | 10,201 | 10,832 | 10,323 | 7,241 | 9,476 | 9,184 | 10,246 |
| 2009 | 10,447 | 9,198 | 10,959 | 10,440 | 11,054 | 11,029 | 11,116 | 10,913 | 10,238 | 10,310 | 9,807 | 9,766 |
| 2010 | 10,138 | 9,251 | 10,810 | 10,681 | 11,317 | 11,376 | 11,694 | 11,728 | 10,035 | 10,369 | 10,321 | 10,959 |
| 2011 | 10,636 | 9,261 | 10,522 | 10,630 | 11,219 | 11,614 | 11,537 | 11,546 | 11,175 | 11,304 | 11,146 | 11,283 |
| 2012 | 10,683 | 9,591 | 10,305 | 10,324 | 11,446 | 11,278 | 11,853 | 11,456 | 10,541 | 10,884 | 10,740 | 11,723 |
| 2013 | 11,184 | 9,449 | 10,897 | 11,166 | 11,737 | 12,125 | 12,668 | 12,646 | 12,066 | 11,616 | 11,697 | 12,061 |
| 2014 | 11,229 | 9,699 | 11,124 | 11,332 | 11,665 | 11,687 | 12,326 | 12,437 | 11,889 | 11,614 | 11,256 | 11,338 |
| 2015 | 10,820 | 9,463 | 10,828 | 10,974 | 11,131 | 10,881 | 11,574 | 11,757 | 10,852 | 11,153 | 11,057 | 11,774 |
| 2016 | 10,782 | 10,366 | 11,418 | 11,113 | 11,765 | 11,529 | 11,975 | 11,679 | 11,216 | 10,563 | 10,804 | 11,447 |
| 2017 | 11,076 | 9,754 | 10,435 | 10,884 | 11,924 | 11,264 | 12,120 | 11,115 | 9,152 | 10,856 | 10,764 | 11,366 |
| 2018 | 10,732 | 9,265 | 11,046 | 10,920 | 11,487 | 11,427 | 11,894 | 12,179 | 11,392 | 11,525 | 10,946 | 11,621 |
| 2019 | 10,571 | 9,555 | 10,208 | 10,085 | 10,866 | 10,637 | 11,353 | 11,294 | 10,126 | 10,342 | 11,113 | 11,926 |
| 2020 | 11,705 | 10,384 | 10,859 | 9,203 | 9,787 | 10,070 | 10,697 | 10,072 | 9,300 | 9,340 | 9,682 | 9,923 |
| 2021 | 10,395 | 7,268 | 9,287 | 10,704 | 12,099 | 11,429 | 11,532 | 11,557 | 9,393 | 10,686 | 10,315 | 11,116 |
| 2022 | 10,205 | 9,121 | 10,453 | 10,871 | 11,318 | 11,249 | 12,138 | 11,407 | 10,977 | 10,784 | 10,892 | 10,426 |
| 2023 | 10,303 | 9,017 | 10,288 | 10,461 | 11,396 | 11,000 | 11,746 | 11,473 | 10,796 | 9,902 | 9,947 | 10,506 |
| 2024 | 9,461 | 8,568 | 9,531 | 9,858 | 10,348 | 10,696 | ||||||
| - = No Data Reported; -- = Not Applicable; NA = Not Available; W = Withheld to avoid disclosure of individual company data. |
| Release Date: 8/30/2024 |
| Next Release Date: 9/30/2024 |