|
Download Data (XLS File) |
|
||||||||
|
||||||||
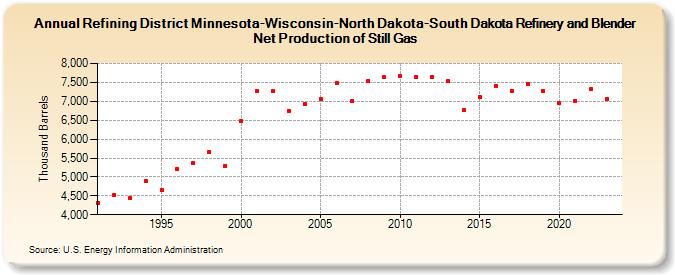
| Refining District Minnesota-Wisconsin-North Dakota-South Dakota Refinery and Blender Net Production of Still Gas (Thousand Barrels) | ||||||||
| Decade | Year-0 | Year-1 | Year-2 | Year-3 | Year-4 | Year-5 | Year-6 | Year-7 | Year-8 | Year-9 |
|---|---|---|---|---|---|---|---|---|---|---|
| 1990's | 4,318 | 4,532 | 4,442 | 4,896 | 4,654 | 5,215 | 5,355 | 5,654 | 5,301 | |
| 2000's | 6,490 | 7,268 | 7,262 | 6,751 | 6,924 | 7,059 | 7,483 | 7,015 | 7,548 | 7,633 |
| 2010's | 7,678 | 7,655 | 7,637 | 7,548 | 6,765 | 7,112 | 7,410 | 7,280 | 7,460 | 7,260 |
| 2020's | 6,961 | 7,007 | 7,314 | 7,066 |
| - = No Data Reported; -- = Not Applicable; NA = Not Available; W = Withheld to avoid disclosure of individual company data. |
| Release Date: 3/29/2024 |
| Next Release Date: 8/30/2024 |