|
Download Data (XLS File) |
|
||||||||
|
||||||||
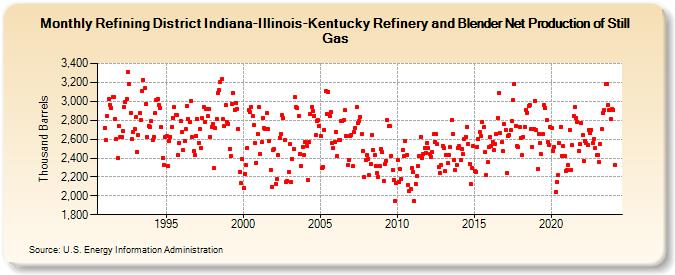
| Refining District Indiana-Illinois-Kentucky Refinery and Blender Net Production of Still Gas (Thousand Barrels) | ||||||||
| Year | Jan | Feb | Mar | Apr | May | Jun | Jul | Aug | Sep | Oct | Nov | Dec |
|---|---|---|---|---|---|---|---|---|---|---|---|---|
| 1991 | 2,721 | 2,587 | 2,841 | 3,021 | 2,965 | 2,928 | 3,046 | 3,041 | 2,816 | 2,596 | 2,399 | 2,740 |
| 1992 | 2,621 | 2,623 | 2,682 | 2,941 | 2,989 | 3,025 | 3,309 | 3,178 | 2,880 | 2,605 | 2,679 | 2,706 |
| 1993 | 2,829 | 2,468 | 2,643 | 2,877 | 2,797 | 3,108 | 3,225 | 3,137 | 2,972 | 2,619 | 2,739 | 2,732 |
| 1994 | 2,788 | 2,588 | 2,625 | 2,873 | 3,009 | 3,028 | 2,962 | 2,924 | 2,727 | 2,401 | 2,327 | 2,622 |
| 1995 | 2,635 | 2,313 | 2,582 | 2,625 | 2,727 | 2,828 | 2,938 | 2,853 | 2,852 | 2,430 | 2,562 | 2,793 |
| 1996 | 2,679 | 2,484 | 2,575 | 2,704 | 2,955 | 2,811 | 2,780 | 3,003 | 2,622 | 2,472 | 2,435 | 2,633 |
| 1997 | 2,813 | 2,562 | 2,708 | 2,510 | 2,823 | 2,939 | 2,782 | 2,915 | 2,841 | 2,918 | 2,626 | 2,727 |
| 1998 | 2,764 | 2,294 | 2,714 | 2,814 | 3,088 | 3,119 | 3,199 | 3,235 | 2,808 | 2,740 | 2,959 | 2,783 |
| 1999 | 2,764 | 2,498 | 2,421 | 2,975 | 3,084 | 2,911 | 2,986 | 2,917 | 2,708 | 2,256 | 2,132 | 2,387 |
| 2000 | 2,080 | 2,231 | 2,328 | 2,509 | 2,910 | 2,882 | 2,937 | 2,841 | 2,750 | 2,559 | 2,351 | 2,649 |
| 2001 | 2,939 | 2,441 | 2,565 | 2,822 | 2,721 | 2,710 | 2,875 | 2,705 | 2,580 | 2,277 | 2,098 | 2,489 |
| 2002 | 2,492 | 2,130 | 2,174 | 2,430 | 2,616 | 2,654 | 2,852 | 2,819 | 2,589 | 2,143 | 2,160 | 2,251 |
| 2003 | 2,544 | 2,147 | 2,389 | 2,490 | 3,044 | 2,938 | 2,928 | 2,845 | 2,445 | 2,314 | 2,521 | 2,429 |
| 2004 | 2,566 | 2,525 | 2,168 | 2,568 | 2,866 | 2,941 | 2,898 | 2,848 | 2,641 | 2,794 | 2,802 | 2,735 |
| 2005 | 2,636 | 2,293 | 2,306 | 2,700 | 3,104 | 2,866 | 3,099 | 2,845 | 2,888 | 2,562 | 2,501 | 2,573 |
| 2006 | 2,677 | 2,417 | 2,586 | 2,589 | 2,794 | 2,793 | 2,797 | 2,905 | 2,637 | 2,323 | 2,378 | 2,630 |
| 2007 | 2,647 | 2,311 | 2,671 | 2,719 | 2,937 | 2,770 | 2,792 | 2,833 | 2,655 | 2,478 | 2,200 | 2,378 |
| 2008 | 2,432 | 2,393 | 2,216 | 2,332 | 2,644 | 2,485 | 2,431 | 2,316 | 2,244 | 2,204 | 2,315 | 2,494 |
| 2009 | 2,459 | 2,161 | 2,336 | 2,371 | 2,801 | 2,738 | 2,735 | 2,422 | 2,274 | 2,171 | 1,942 | 2,140 |
| 2010 | 2,379 | 2,147 | 2,283 | 2,174 | 2,486 | 2,418 | 2,582 | 2,428 | 2,113 | 2,048 | 2,067 | 2,296 |
| 2011 | 2,255 | 1,942 | 2,123 | 2,205 | 2,317 | 2,419 | 2,626 | 2,404 | 2,440 | 2,507 | 2,454 | 2,563 |
| 2012 | 2,505 | 2,443 | 2,411 | 2,466 | 2,650 | 2,573 | 2,659 | 2,543 | 2,306 | 2,242 | 2,331 | 2,532 |
| 2013 | 2,510 | 2,259 | 2,433 | 2,346 | 2,428 | 2,515 | 2,803 | 2,657 | 2,377 | 2,268 | 2,326 | 2,507 |
| 2014 | 2,523 | 2,375 | 2,496 | 2,438 | 2,605 | 2,627 | 2,729 | 2,549 | 2,340 | 2,125 | 2,298 | 2,522 |
| 2015 | 2,264 | 2,255 | 2,518 | 2,600 | 2,674 | 2,635 | 2,782 | 2,723 | 2,461 | 2,217 | 2,357 | 2,513 |
| 2016 | 2,622 | 2,528 | 2,573 | 2,480 | 2,549 | 2,657 | 2,824 | 3,086 | 2,664 | 2,568 | 2,469 | 2,757 |
| 2017 | 2,701 | 2,240 | 2,628 | 2,646 | 2,693 | 2,790 | 3,009 | 3,183 | 2,742 | 2,529 | 2,512 | 2,733 |
| 2018 | 2,616 | 2,428 | 2,627 | 2,731 | 2,911 | 2,881 | 2,949 | 2,965 | 2,703 | 2,520 | 2,711 | 3,008 |
| 2019 | 2,692 | 2,282 | 2,659 | 2,562 | 2,438 | 2,652 | 2,962 | 2,933 | 2,799 | 2,568 | 2,536 | 2,730 |
| 2020 | 2,721 | 2,474 | 2,515 | 2,041 | 2,148 | 2,217 | 2,557 | 2,728 | 2,426 | 2,525 | 2,422 | 2,265 |
| 2021 | 2,277 | 2,323 | 2,700 | 2,273 | 2,535 | 2,845 | 2,935 | 2,828 | 2,776 | 2,478 | 2,543 | 2,773 |
| 2022 | 2,642 | 2,368 | 2,582 | 2,554 | 2,537 | 2,700 | 2,669 | 2,698 | 2,557 | 2,600 | 2,502 | 2,427 |
| 2023 | 2,433 | 2,357 | 2,546 | 2,704 | 2,876 | 2,906 | 3,181 | 3,183 | 2,966 | 2,906 | 2,808 | 2,918 |
| 2024 | 2,912 | |||||||||||
| - = No Data Reported; -- = Not Applicable; NA = Not Available; W = Withheld to avoid disclosure of individual company data. |
| Release Date: 3/29/2024 |
| Next Release Date: 4/30/2024 |