|
Download Data (XLS File) |
|
||||||||
|
||||||||
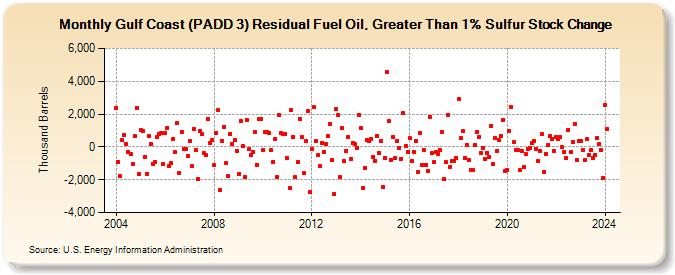
| Gulf Coast (PADD 3) Residual Fuel Oil, Greater Than 1% Sulfur Stock Change (Thousand Barrels) | ||||||||
| Year | Jan | Feb | Mar | Apr | May | Jun | Jul | Aug | Sep | Oct | Nov | Dec |
|---|---|---|---|---|---|---|---|---|---|---|---|---|
| 2004 | 2,349 | -930 | -1,747 | 397 | 699 | 153 | -315 | -454 | -1,043 | 674 | 2,396 | -1,676 |
| 2005 | 1,008 | 948 | -614 | -1,662 | 669 | 182 | -1,031 | -913 | 581 | 808 | 862 | -1,028 |
| 2006 | 838 | 1,145 | -1,187 | -991 | 502 | -328 | 1,430 | -1,594 | 928 | -153 | -141 | -535 |
| 2007 | 331 | -1,158 | 1,115 | -192 | -1,966 | 975 | 797 | -386 | -522 | 1,695 | 218 | 414 |
| 2008 | -1,128 | 824 | 2,218 | -2,622 | 369 | 1,230 | -1,010 | -1,765 | 803 | 199 | 390 | -233 |
| 2009 | -1,676 | 1,592 | 27 | -1,843 | 1,640 | -155 | -516 | -324 | 885 | -1,077 | 1,712 | 1,684 |
| 2010 | -172 | 931 | 879 | 864 | -193 | -923 | 493 | -1,854 | 1,914 | 858 | 763 | 788 |
| 2011 | -694 | -2,516 | 2,220 | 620 | -1,851 | -927 | 1,717 | 595 | -1,594 | 340 | 2,156 | -2,748 |
| 2012 | -100 | 2,401 | 386 | -517 | -1,176 | 263 | -283 | 188 | 648 | 1,394 | -817 | -2,846 |
| 2013 | 2,336 | 1,970 | -1,864 | 1,153 | -868 | -222 | 602 | -727 | 220 | 192 | -59 | 1,968 |
| 2014 | 1,162 | -2,475 | -1,264 | 393 | 389 | 483 | -602 | -848 | 684 | -391 | 376 | -2,416 |
| 2015 | -656 | 4,558 | 1,549 | -796 | 603 | -681 | 359 | -81 | -715 | 2,047 | 82 | -322 |
| 2016 | 526 | -837 | -331 | 383 | -1,519 | 840 | -1,076 | -159 | -1,084 | -1,448 | 1,837 | -394 |
| 2017 | -949 | -283 | -414 | -217 | 905 | -1,979 | -949 | 1,943 | -1,206 | -852 | -842 | -696 |
| 2018 | 2,937 | 527 | 954 | -697 | 118 | -800 | -1,384 | -1,419 | 117 | 936 | 632 | -366 |
| 2019 | -46 | -754 | -359 | -637 | 1,288 | -1,056 | 559 | -258 | 398 | 679 | 1,666 | -1,476 |
| 2020 | -1,422 | 975 | 2,424 | 286 | -195 | -218 | -1,437 | -240 | -1,243 | -438 | -127 | -96 |
| 2021 | 207 | 376 | -118 | -866 | -257 | 782 | -1,541 | -417 | 113 | 686 | 461 | -256 |
| 2022 | 614 | 511 | 573 | -35 | -338 | -668 | 1,055 | -322 | 303 | 1,396 | -812 | 340 |
| 2023 | 339 | -164 | -827 | 460 | -494 | -200 | -691 | -491 | 551 | 156 | -218 | -1,879 |
| 2024 | 2,567 | |||||||||||
| - = No Data Reported; -- = Not Applicable; NA = Not Available; W = Withheld to avoid disclosure of individual company data. |
| Release Date: 3/29/2024 |
| Next Release Date: 4/30/2024 |