|
Download Data (XLS File) |
|
||||||||
|
||||||||
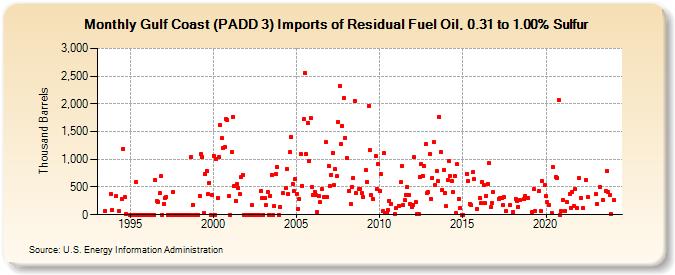
| Gulf Coast (PADD 3) Imports of Residual Fuel Oil, 0.31 to 1.00% Sulfur (Thousand Barrels) | ||||||||
| Year | Jan | Feb | Mar | Apr | May | Jun | Jul | Aug | Sep | Oct | Nov | Dec |
|---|---|---|---|---|---|---|---|---|---|---|---|---|
| 1993 | 61 | 373 | 86 | |||||||||
| 1994 | 335 | 61 | 291 | 1,194 | 312 | 13 | ||||||
| 1995 | 0 | 0 | 0 | 0 | 591 | 0 | 0 | 0 | 0 | 0 | 0 | 0 |
| 1996 | 0 | 0 | 0 | 0 | 0 | 0 | 619 | 242 | 236 | 391 | 691 | 1 |
| 1997 | 198 | 304 | 311 | 0 | 0 | 0 | 0 | 410 | 0 | 0 | 0 | 0 |
| 1998 | 0 | 0 | 0 | 0 | 0 | 0 | 0 | 0 | 1,037 | 183 | 0 | 0 |
| 1999 | 0 | 0 | 340 | 1,095 | 1,046 | 29 | 737 | 797 | 369 | 577 | 0 | 361 |
| 2000 | 1,066 | 0 | 998 | 307 | 1,042 | 1,617 | 1,379 | 1,208 | 1,223 | 1,722 | 1,707 | 332 |
| 2001 | 0 | 1,123 | 1,768 | 514 | 248 | 552 | 473 | 370 | 672 | 721 | 0 | 0 |
| 2002 | 0 | 0 | 0 | 0 | 167 | 0 | 0 | 0 | 0 | 0 | 429 | 305 |
| 2003 | 0 | 307 | 170 | 411 | 0 | 343 | 718 | 0 | 156 | 739 | 858 | 0 |
| 2004 | 141 | 383 | 475 | 826 | 375 | 1,123 | 1,402 | 562 | 419 | 646 | ||
| 2005 | 375 | 105 | 286 | 1,093 | 526 | 1,726 | 2,560 | 1,093 | 1,663 | 962 | 1,747 | 491 |
| 2006 | 353 | 414 | 350 | 45 | 339 | 223 | 455 | 320 | 1,303 | 314 | 886 | |
| 2007 | 516 | 721 | 1,120 | 531 | 817 | 690 | 1,676 | 2,319 | 1,271 | 1,607 | 2,108 | 1,391 |
| 2008 | 1,024 | 435 | 192 | 499 | 662 | 2,053 | 383 | 458 | 470 | 390 | ||
| 2009 | 317 | 801 | 597 | 1,963 | 1,166 | 351 | 288 | 1,051 | 459 | 921 | ||
| 2010 | 436 | 728 | 65 | 1,105 | 30 | 28 | 86 | 253 | 195 | 14 | ||
| 2011 | 117 | 165 | 584 | 884 | 175 | 265 | 364 | 496 | 348 | 186 | 141 | |
| 2012 | 182 | 1,035 | 228 | 11 | 4 | 685 | 906 | 706 | 872 | 1,268 | 387 | 405 |
| 2013 | 1,100 | 286 | 665 | 1,309 | 530 | 791 | 608 | 1,768 | 1,131 | 447 | 806 | 386 |
| 2014 | 152 | 618 | 964 | 697 | 612 | 409 | 698 | 25 | 907 | 288 | 118 | 3 |
| 2015 | 3 | 735 | 601 | 199 | 170 | 764 | 640 | 107 | ||||
| 2016 | 299 | 206 | 587 | 539 | 205 | 339 | 562 | 926 | 134 | 220 | 409 | |
| 2017 | 285 | 298 | 302 | 167 | 311 | 60 | 171 | |||||
| 2018 | 50 | 290 | 242 | 148 | 263 | 280 | 345 | 306 | 302 | |||
| 2019 | 57 | 455 | 66 | 431 | 68 | 608 | 536 | |||||
| 2020 | 332 | 221 | 178 | 38 | 861 | 684 | 670 | 2,065 | 1 | 65 | ||
| 2021 | 270 | 65 | 225 | 375 | 125 | 410 | 149 | 460 | 115 | |||
| 2022 | 657 | 302 | 119 | 630 | 313 | |||||||
| 2023 | 368 | 202 | 495 | 263 | 425 | 791 | 414 | 362 | 13 | |||
| 2024 | 273 | 298 | 156 | 66 | ||||||||
| - = No Data Reported; -- = Not Applicable; NA = Not Available; W = Withheld to avoid disclosure of individual company data. |
| Release Date: 8/30/2024 |
| Next Release Date: 9/30/2024 |