|
Download Data (XLS File) |
|
||||||||
|
||||||||
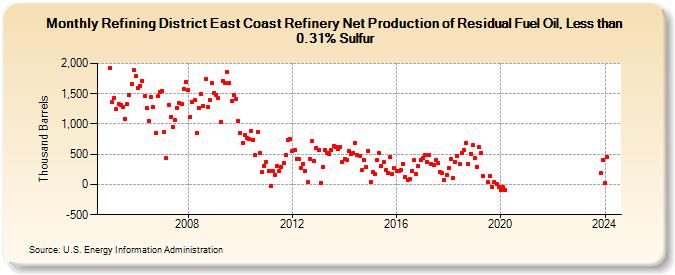
| Refining District East Coast Refinery Net Production of Residual Fuel Oil, Less than 0.31% Sulfur (Thousand Barrels) | ||||||||
| Year | Jan | Feb | Mar | Apr | May | Jun | Jul | Aug | Sep | Oct | Nov | Dec |
|---|---|---|---|---|---|---|---|---|---|---|---|---|
| 2005 | 1,927 | 1,359 | 1,430 | 1,240 | 1,338 | 1,313 | 1,284 | 1,080 | 1,333 | 1,473 | 1,660 | 1,893 |
| 2006 | 1,792 | 1,593 | 1,628 | 1,707 | 1,458 | 1,265 | 1,041 | 1,443 | 1,280 | 848 | 1,461 | 1,523 |
| 2007 | 1,550 | 873 | 444 | 1,320 | 1,108 | 956 | 1,060 | 1,265 | 1,348 | 1,334 | 1,571 | 1,697 |
| 2008 | 1,556 | 1,119 | 1,370 | 1,394 | 847 | 1,272 | 1,495 | 1,289 | 1,744 | 1,282 | 1,396 | 1,670 |
| 2009 | 1,514 | 1,486 | 1,424 | 1,033 | 1,709 | 1,671 | 1,861 | 1,679 | 1,372 | 1,473 | 1,406 | 1,048 |
| 2010 | 844 | 693 | 812 | 773 | 755 | 889 | 737 | 484 | 862 | 513 | 202 | 308 |
| 2011 | 368 | 225 | -23 | 226 | 157 | 299 | 228 | 281 | 360 | 485 | 742 | 756 |
| 2012 | 547 | 567 | 429 | 414 | 276 | 342 | 227 | 35 | 415 | 714 | 392 | 609 |
| 2013 | 577 | 30 | 283 | 578 | 528 | 503 | 563 | 644 | 627 | 579 | 620 | 373 |
| 2014 | 421 | 410 | 546 | 498 | 524 | 690 | 481 | 472 | 233 | 405 | 297 | 559 |
| 2015 | 34 | 198 | 172 | 408 | 516 | 313 | 368 | 234 | 196 | 449 | 180 | 279 |
| 2016 | 223 | 222 | 233 | 335 | 124 | 75 | 84 | 227 | 404 | 167 | 301 | 402 |
| 2017 | 430 | 490 | 374 | 480 | 337 | 325 | 402 | 360 | 210 | 182 | 76 | 152 |
| 2018 | 279 | 423 | 113 | 372 | 477 | 341 | 525 | 567 | 685 | 339 | 505 | 646 |
| 2019 | 434 | 289 | 622 | 527 | 140 | 41 | 133 | -45 | 48 | 1 | -38 | |
| 2020 | -89 | -36 | -85 | |||||||||
| 2023 | 185 | 409 | ||||||||||
| 2024 | 31 | |||||||||||
| - = No Data Reported; -- = Not Applicable; NA = Not Available; W = Withheld to avoid disclosure of individual company data. |
| Release Date: 3/29/2024 |
| Next Release Date: 4/30/2024 |