|
Download Data (XLS File) |
|
||||||||
|
||||||||
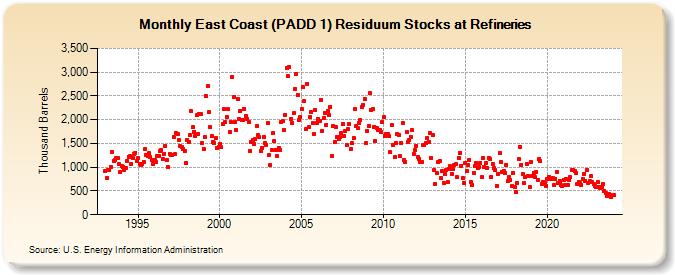
| East Coast (PADD 1) Residuum Stocks at Refineries (Thousand Barrels) | ||||||||
| Year | Jan | Feb | Mar | Apr | May | Jun | Jul | Aug | Sep | Oct | Nov | Dec |
|---|---|---|---|---|---|---|---|---|---|---|---|---|
| 1993 | 926 | 779 | 941 | 943 | 1,008 | 1,323 | 1,134 | 1,159 | 1,188 | 1,190 | 1,065 | 900 |
| 1994 | 1,023 | 1,013 | 943 | 978 | 1,137 | 1,223 | 1,227 | 1,077 | 1,192 | 1,285 | 1,309 | 1,136 |
| 1995 | 1,197 | 1,064 | 1,050 | 1,071 | 1,112 | 1,392 | 1,257 | 1,239 | 1,289 | 1,210 | 1,157 | 1,076 |
| 1996 | 1,154 | 1,106 | 1,245 | 1,234 | 1,340 | 1,359 | 1,173 | 1,287 | 1,444 | 1,150 | 996 | 1,283 |
| 1997 | 1,260 | 1,255 | 1,640 | 1,277 | 1,714 | 1,693 | 1,565 | 1,436 | 1,421 | 1,383 | 1,337 | 1,078 |
| 1998 | 1,572 | 1,536 | 1,681 | 2,172 | 1,836 | 1,747 | 1,649 | 2,088 | 1,708 | 2,116 | 2,110 | 1,508 |
| 1999 | 1,386 | 1,628 | 2,502 | 2,705 | 2,159 | 1,844 | 1,646 | 1,539 | 1,507 | 1,604 | 1,410 | 1,421 |
| 2000 | 1,494 | 1,417 | 1,908 | 2,235 | 1,945 | 2,048 | 2,217 | 1,739 | 1,954 | 2,907 | 2,473 | 1,958 |
| 2001 | 1,786 | 2,429 | 2,015 | 2,182 | 1,996 | 1,986 | 2,234 | 2,080 | 2,024 | 1,956 | 1,336 | 1,538 |
| 2002 | 1,567 | 1,487 | 1,592 | 1,867 | 1,675 | 1,633 | 1,346 | 1,406 | 1,635 | 1,502 | 1,475 | 1,936 |
| 2003 | 1,262 | 1,047 | 1,359 | 1,710 | 1,555 | 1,362 | 1,226 | 1,401 | 1,367 | 1,946 | 1,963 | 1,781 |
| 2004 | 2,103 | 3,090 | 2,912 | 3,112 | 2,019 | 1,938 | 2,130 | 2,652 | 2,956 | 2,529 | 2,000 | 2,053 |
| 2005 | 2,222 | 2,686 | 2,397 | 1,803 | 2,761 | 1,839 | 2,061 | 2,156 | 1,923 | 1,706 | 2,201 | 1,938 |
| 2006 | 2,017 | 1,978 | 2,416 | 1,764 | 2,030 | 2,136 | 1,896 | 2,190 | 2,098 | 2,273 | 1,230 | 1,873 |
| 2007 | 1,521 | 1,836 | 1,638 | 1,587 | 1,630 | 1,714 | 1,908 | 1,648 | 1,752 | 1,460 | 1,803 | 1,901 |
| 2008 | 1,377 | 1,503 | 1,614 | 2,217 | 1,874 | 1,823 | 1,928 | 2,002 | 2,270 | 2,314 | 2,433 | 1,500 |
| 2009 | 1,758 | 1,877 | 2,551 | 2,210 | 2,219 | 1,851 | 1,550 | 1,825 | 1,778 | 1,790 | 1,751 | 1,943 |
| 2010 | 2,054 | 1,659 | 1,703 | 1,695 | 1,649 | 1,311 | 1,878 | 1,467 | 1,219 | 1,514 | 1,706 | 1,683 |
| 2011 | 1,232 | 1,500 | 1,937 | 1,147 | 1,117 | 1,734 | 1,526 | 1,575 | 1,640 | 1,782 | 1,279 | 1,356 |
| 2012 | 1,454 | 1,210 | 1,182 | 1,117 | 1,112 | 1,467 | 1,465 | 1,500 | 1,611 | 1,523 | 1,713 | 1,197 |
| 2013 | 1,687 | 934 | 650 | 875 | 1,103 | 1,126 | 770 | 919 | 669 | 858 | 936 | 686 |
| 2014 | 967 | 1,016 | 867 | 953 | 1,040 | 1,057 | 787 | 1,194 | 1,306 | 1,034 | 768 | 668 |
| 2015 | 1,097 | 921 | 1,049 | 1,160 | 689 | 626 | 880 | 1,022 | 1,094 | 986 | 1,011 | 1,092 |
| 2016 | 786 | 1,201 | 1,007 | 1,095 | 992 | 1,196 | 1,173 | 799 | 1,077 | 978 | 937 | 611 |
| 2017 | 863 | 1,301 | 1,102 | 890 | 917 | 873 | 1,054 | 702 | 788 | 734 | 603 | 879 |
| 2018 | 584 | 477 | 677 | 1,175 | 1,431 | 1,054 | 863 | 665 | 791 | 1,068 | 812 | 587 |
| 2019 | 1,106 | 807 | 876 | 799 | 899 | 730 | 1,172 | 1,120 | 649 | 697 | 677 | 614 |
| 2020 | 751 | 795 | 749 | 762 | 775 | 630 | 754 | 904 | 658 | 712 | 625 | 598 |
| 2021 | 741 | 615 | 754 | 633 | 729 | 787 | 945 | 946 | 912 | 879 | 646 | 687 |
| 2022 | 670 | 622 | 748 | 863 | 717 | 935 | 677 | 707 | 811 | 681 | 638 | 603 |
| 2023 | 584 | 688 | 573 | 555 | 573 | 640 | 507 | 457 | 392 | 433 | 397 | 379 |
| 2024 | 416 | |||||||||||
| - = No Data Reported; -- = Not Applicable; NA = Not Available; W = Withheld to avoid disclosure of individual company data. |
| Release Date: 3/29/2024 |
| Next Release Date: 4/30/2024 |