|
Download Data (XLS File) |
|
||||||||
|
||||||||
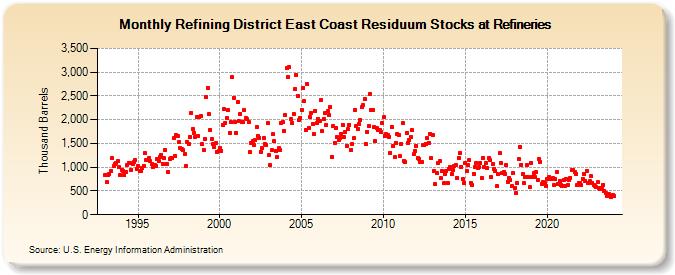
| Refining District East Coast Residuum Stocks at Refineries (Thousand Barrels) | ||||||||
| Year | Jan | Feb | Mar | Apr | May | Jun | Jul | Aug | Sep | Oct | Nov | Dec |
|---|---|---|---|---|---|---|---|---|---|---|---|---|
| 1993 | 834 | 682 | 832 | 848 | 911 | 1,189 | 1,017 | 1,061 | 1,094 | 1,120 | 997 | 828 |
| 1994 | 943 | 922 | 834 | 897 | 1,054 | 1,089 | 1,089 | 951 | 1,069 | 1,108 | 1,141 | 971 |
| 1995 | 1,028 | 920 | 923 | 982 | 1,033 | 1,290 | 1,155 | 1,149 | 1,188 | 1,125 | 1,077 | 997 |
| 1996 | 1,052 | 1,021 | 1,166 | 1,124 | 1,217 | 1,262 | 1,068 | 1,184 | 1,360 | 1,071 | 894 | 1,171 |
| 1997 | 1,190 | 1,201 | 1,604 | 1,244 | 1,671 | 1,650 | 1,538 | 1,406 | 1,384 | 1,355 | 1,281 | 1,024 |
| 1998 | 1,523 | 1,492 | 1,643 | 2,145 | 1,804 | 1,724 | 1,625 | 2,059 | 1,661 | 2,059 | 2,067 | 1,481 |
| 1999 | 1,369 | 1,603 | 2,475 | 2,676 | 2,113 | 1,793 | 1,597 | 1,478 | 1,425 | 1,508 | 1,320 | 1,332 |
| 2000 | 1,402 | 1,350 | 1,898 | 2,215 | 1,930 | 2,033 | 2,202 | 1,729 | 1,945 | 2,892 | 2,466 | 1,953 |
| 2001 | 1,730 | 2,367 | 1,964 | 2,127 | 1,948 | 1,942 | 2,195 | 2,036 | 2,008 | 1,947 | 1,324 | 1,519 |
| 2002 | 1,552 | 1,469 | 1,573 | 1,855 | 1,664 | 1,624 | 1,330 | 1,397 | 1,619 | 1,492 | 1,459 | 1,926 |
| 2003 | 1,251 | 1,040 | 1,354 | 1,692 | 1,545 | 1,351 | 1,214 | 1,394 | 1,357 | 1,935 | 1,949 | 1,772 |
| 2004 | 2,095 | 3,082 | 2,908 | 3,104 | 2,014 | 1,934 | 2,122 | 2,644 | 2,945 | 2,498 | 1,994 | 2,042 |
| 2005 | 2,211 | 2,677 | 2,391 | 1,793 | 2,749 | 1,834 | 2,053 | 2,150 | 1,916 | 1,696 | 2,192 | 1,927 |
| 2006 | 2,006 | 1,972 | 2,406 | 1,757 | 2,023 | 2,130 | 1,887 | 2,182 | 2,091 | 2,265 | 1,223 | 1,866 |
| 2007 | 1,515 | 1,829 | 1,631 | 1,578 | 1,624 | 1,704 | 1,897 | 1,635 | 1,741 | 1,451 | 1,794 | 1,893 |
| 2008 | 1,371 | 1,495 | 1,606 | 2,202 | 1,863 | 1,812 | 1,919 | 1,994 | 2,263 | 2,308 | 2,425 | 1,492 |
| 2009 | 1,751 | 1,870 | 2,545 | 2,202 | 2,209 | 1,844 | 1,542 | 1,819 | 1,773 | 1,781 | 1,746 | 1,939 |
| 2010 | 2,050 | 1,652 | 1,695 | 1,687 | 1,645 | 1,303 | 1,855 | 1,449 | 1,207 | 1,510 | 1,701 | 1,678 |
| 2011 | 1,229 | 1,493 | 1,933 | 1,140 | 1,110 | 1,725 | 1,519 | 1,569 | 1,634 | 1,775 | 1,269 | 1,349 |
| 2012 | 1,449 | 1,203 | 1,176 | 1,112 | 1,106 | 1,463 | 1,457 | 1,493 | 1,605 | 1,516 | 1,706 | 1,188 |
| 2013 | 1,681 | 927 | 639 | 869 | 1,095 | 1,120 | 763 | 911 | 659 | 850 | 927 | 677 |
| 2014 | 960 | 1,006 | 854 | 944 | 1,031 | 1,052 | 780 | 1,189 | 1,299 | 1,009 | 748 | 661 |
| 2015 | 1,091 | 914 | 1,040 | 1,150 | 677 | 625 | 865 | 1,013 | 1,090 | 979 | 1,003 | 1,087 |
| 2016 | 778 | 1,194 | 994 | 1,086 | 982 | 1,186 | 1,159 | 788 | 1,063 | 962 | 926 | 594 |
| 2017 | 854 | 1,291 | 1,095 | 872 | 908 | 864 | 1,044 | 694 | 780 | 723 | 597 | 871 |
| 2018 | 564 | 467 | 665 | 1,170 | 1,423 | 1,048 | 856 | 658 | 787 | 1,048 | 799 | 576 |
| 2019 | 1,097 | 801 | 872 | 794 | 892 | 725 | 1,163 | 1,112 | 644 | 690 | 672 | 608 |
| 2020 | 746 | 790 | 746 | 756 | 771 | 625 | 746 | 897 | 655 | 707 | 619 | 594 |
| 2021 | 739 | 611 | 749 | 622 | 724 | 783 | 937 | 938 | 905 | 861 | 632 | 677 |
| 2022 | 664 | 617 | 744 | 857 | 711 | 928 | 673 | 704 | 808 | 671 | 631 | 596 |
| 2023 | 576 | 682 | 570 | 550 | 565 | 633 | 501 | 450 | 390 | 430 | 394 | 376 |
| 2024 | 413 | |||||||||||
| - = No Data Reported; -- = Not Applicable; NA = Not Available; W = Withheld to avoid disclosure of individual company data. |
| Release Date: 3/29/2024 |
| Next Release Date: 4/30/2024 |
Referring Pages: