|
Download Data (XLS File) |
|
||||||||
|
||||||||
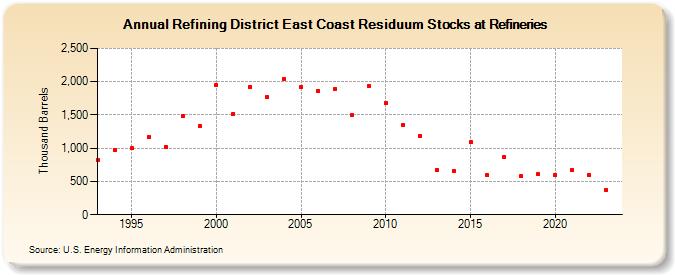
| Refining District East Coast Residuum Stocks at Refineries (Thousand Barrels) | ||||||||
| Decade | Year-0 | Year-1 | Year-2 | Year-3 | Year-4 | Year-5 | Year-6 | Year-7 | Year-8 | Year-9 |
|---|---|---|---|---|---|---|---|---|---|---|
| 1990's | 828 | 971 | 997 | 1,171 | 1,024 | 1,481 | 1,332 | |||
| 2000's | 1,953 | 1,519 | 1,926 | 1,772 | 2,042 | 1,927 | 1,866 | 1,893 | 1,492 | 1,939 |
| 2010's | 1,678 | 1,349 | 1,188 | 677 | 661 | 1,087 | 594 | 871 | 576 | 608 |
| 2020's | 594 | 677 | 596 | 376 |
| - = No Data Reported; -- = Not Applicable; NA = Not Available; W = Withheld to avoid disclosure of individual company data. |
| Release Date: 3/29/2024 |
| Next Release Date: 8/30/2024 |
Referring Pages: