|
Download Data (XLS File) |
|
||||||||
|
||||||||
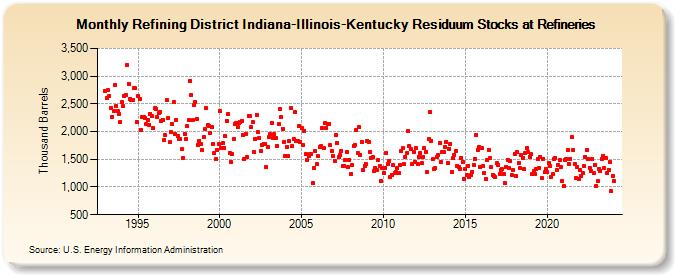
| Refining District Indiana-Illinois-Kentucky Residuum Stocks at Refineries (Thousand Barrels) | ||||||||
| Year | Jan | Feb | Mar | Apr | May | Jun | Jul | Aug | Sep | Oct | Nov | Dec |
|---|---|---|---|---|---|---|---|---|---|---|---|---|
| 1993 | 2,732 | 2,610 | 2,742 | 2,647 | 2,423 | 2,269 | 2,379 | 2,847 | 2,467 | 2,372 | 2,320 | 2,175 |
| 1994 | 2,528 | 2,453 | 2,646 | 2,661 | 3,204 | 2,866 | 2,584 | 2,565 | 2,566 | 2,785 | 2,781 | 2,179 |
| 1995 | 2,638 | 2,581 | 2,026 | 2,261 | 2,271 | 2,253 | 2,134 | 2,200 | 2,123 | 2,319 | 2,284 | 2,062 |
| 1996 | 2,418 | 2,413 | 2,256 | 2,326 | 2,352 | 2,199 | 2,213 | 1,844 | 1,930 | 2,565 | 2,244 | 1,806 |
| 1997 | 1,983 | 2,143 | 2,529 | 1,951 | 2,211 | 1,925 | 1,865 | 1,862 | 1,679 | 1,527 | 1,960 | 1,866 |
| 1998 | 2,098 | 2,207 | 2,918 | 2,660 | 2,208 | 2,484 | 2,542 | 2,235 | 1,762 | 1,834 | 1,781 | 1,672 |
| 1999 | 1,905 | 2,043 | 2,420 | 2,121 | 2,094 | 1,968 | 2,077 | 1,781 | 1,607 | 1,500 | 1,659 | 1,769 |
| 2000 | 2,367 | 1,702 | 1,786 | 1,698 | 1,911 | 2,189 | 2,317 | 1,621 | 1,448 | 1,590 | 1,873 | 2,132 |
| 2001 | 2,150 | 2,080 | 2,155 | 2,174 | 2,195 | 1,942 | 1,501 | 1,963 | 1,542 | 2,277 | 2,273 | 2,074 |
| 2002 | 2,173 | 1,637 | 1,866 | 2,306 | 1,986 | 1,890 | 1,653 | 1,766 | 1,772 | 1,780 | 1,360 | 1,729 |
| 2003 | 1,897 | 1,948 | 2,153 | 1,879 | 1,949 | 1,889 | 1,743 | 2,142 | 2,399 | 2,261 | 2,053 | 1,815 |
| 2004 | 1,551 | 1,722 | 1,551 | 1,822 | 2,424 | 1,733 | 1,874 | 2,346 | 1,834 | 1,833 | 2,101 | 1,803 |
| 2005 | 2,063 | 1,765 | 2,018 | 1,588 | 1,490 | 1,567 | 1,587 | 1,593 | 1,068 | 1,339 | 1,646 | 1,411 |
| 2006 | 1,555 | 1,718 | 1,734 | 2,069 | 1,705 | 2,162 | 2,065 | 2,137 | 2,145 | 1,751 | 1,642 | 1,559 |
| 2007 | 1,475 | 1,938 | 1,802 | 1,532 | 1,578 | 1,655 | 1,379 | 1,380 | 1,490 | 1,634 | 1,356 | 1,493 |
| 2008 | 1,239 | 1,400 | 1,748 | 1,754 | 2,020 | 1,617 | 2,080 | 1,585 | 1,820 | 1,311 | 1,381 | 1,423 |
| 2009 | 1,837 | 1,820 | 1,637 | 1,527 | 1,533 | 1,292 | 1,339 | 1,314 | 1,486 | 1,382 | 1,116 | 1,346 |
| 2010 | 1,259 | 1,343 | 1,612 | 1,417 | 1,473 | 1,184 | 1,223 | 1,395 | 1,252 | 1,268 | 1,338 | 1,246 |
| 2011 | 1,398 | 1,642 | 1,698 | 1,407 | 1,547 | 1,612 | 2,006 | 1,741 | 1,678 | 1,422 | 1,627 | 1,458 |
| 2012 | 1,699 | 1,421 | 1,550 | 1,621 | 1,424 | 1,544 | 1,695 | 1,632 | 1,275 | 1,859 | 2,360 | 1,835 |
| 2013 | 1,496 | 1,325 | 1,338 | 1,540 | 1,569 | 1,796 | 1,453 | 1,636 | 1,631 | 1,725 | 1,818 | 1,436 |
| 2014 | 1,694 | 1,781 | 1,269 | 1,514 | 1,584 | 1,651 | 1,380 | 1,354 | 1,332 | 1,528 | 1,455 | 1,144 |
| 2015 | 1,316 | 1,215 | 1,386 | 1,186 | 1,211 | 1,277 | 1,399 | 1,511 | 1,946 | 1,669 | 1,719 | 1,355 |
| 2016 | 1,698 | 1,377 | 1,255 | 1,153 | 1,480 | 1,674 | 1,519 | 1,365 | 1,219 | 1,194 | 1,173 | 1,426 |
| 2017 | 1,396 | 1,235 | 1,311 | 1,319 | 1,239 | 1,070 | 1,362 | 1,489 | 1,350 | 1,462 | 1,215 | 1,315 |
| 2018 | 1,598 | 1,204 | 1,639 | 1,432 | 1,338 | 1,579 | 1,527 | 1,317 | 1,613 | 1,698 | 1,627 | 1,550 |
| 2019 | 1,588 | 1,233 | 1,288 | 1,234 | 1,328 | 1,507 | 1,337 | 1,549 | 1,156 | 1,505 | 1,262 | 1,332 |
| 2020 | 1,269 | 1,435 | 1,372 | 1,183 | 1,231 | 1,500 | 1,524 | 1,314 | 1,393 | 1,480 | 1,362 | 1,101 |
| 2021 | 1,011 | 1,493 | 1,511 | 1,662 | 1,419 | 1,505 | 1,904 | 1,666 | 1,416 | 1,168 | 1,363 | 1,147 |
| 2022 | 1,308 | 1,204 | 1,256 | 1,379 | 1,545 | 1,664 | 1,496 | 1,351 | 1,286 | 1,501 | 1,246 | 1,402 |
| 2023 | 1,018 | 1,102 | 1,325 | 1,286 | 1,512 | 1,568 | 1,351 | 1,525 | 1,254 | 1,315 | 1,442 | 921 |
| 2024 | 1,196 | |||||||||||
| - = No Data Reported; -- = Not Applicable; NA = Not Available; W = Withheld to avoid disclosure of individual company data. |
| Release Date: 3/29/2024 |
| Next Release Date: 4/30/2024 |