|
Download Data (XLS File) |
|
||||||||
|
||||||||
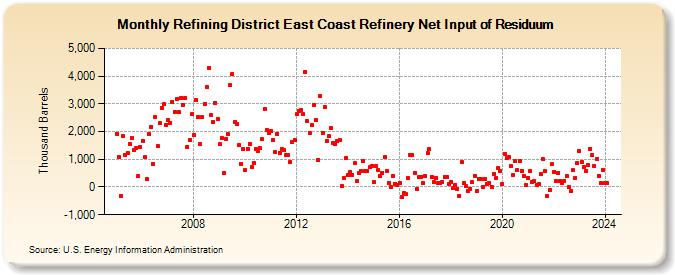
| Refining District East Coast Refinery Net Input of Residuum (Thousand Barrels) | ||||||||
| Year | Jan | Feb | Mar | Apr | May | Jun | Jul | Aug | Sep | Oct | Nov | Dec |
|---|---|---|---|---|---|---|---|---|---|---|---|---|
| 2005 | 1,922 | 1,070 | -326 | 1,831 | 1,170 | 1,229 | 1,564 | 1,762 | 1,328 | 1,399 | 403 | 1,440 |
| 2006 | 1,672 | 1,076 | 295 | 1,924 | 2,179 | 837 | 2,510 | 1,474 | 2,297 | 2,856 | 2,976 | 2,238 |
| 2007 | 2,423 | 2,302 | 3,079 | 2,710 | 3,181 | 2,703 | 3,223 | 2,970 | 3,216 | 1,456 | 1,694 | 2,624 |
| 2008 | 1,873 | 3,130 | 2,516 | 1,546 | 2,510 | 2,986 | 3,599 | 4,297 | 2,583 | 2,342 | 3,037 | 2,436 |
| 2009 | 1,541 | 1,781 | 518 | 1,733 | 1,914 | 3,665 | 4,083 | 2,339 | 2,260 | 1,508 | 843 | 1,380 |
| 2010 | 616 | 1,386 | 1,562 | 711 | 878 | 1,364 | 1,300 | 1,390 | 1,719 | 2,797 | 2,052 | 1,940 |
| 2011 | 2,019 | 1,686 | 1,270 | 1,916 | 1,233 | 1,387 | 1,320 | 1,141 | 1,138 | 896 | 1,634 | 1,679 |
| 2012 | 2,623 | 2,740 | 2,764 | 2,628 | 4,159 | 2,364 | 1,937 | 2,219 | 2,959 | 2,405 | 975 | 3,291 |
| 2013 | 1,961 | 2,898 | 1,653 | 1,825 | 2,112 | 1,579 | 1,562 | 1,667 | 1,696 | 40 | 326 | 1,047 |
| 2014 | 418 | 532 | 427 | 855 | 211 | 492 | 572 | 955 | 569 | 562 | 712 | 747 |
| 2015 | 175 | 744 | 612 | 408 | 517 | 1,066 | 562 | 157 | -6 | 389 | 122 | 60 |
| 2016 | 156 | -367 | -200 | -270 | 325 | 1,146 | 1,147 | 522 | -78 | 347 | 372 | 137 |
| 2017 | 403 | 1,213 | 1,364 | 375 | 166 | 342 | 130 | 154 | 186 | 371 | 361 | 106 |
| 2018 | 195 | -46 | 81 | -72 | -321 | 899 | 130 | 19 | -153 | -59 | 170 | 410 |
| 2019 | -146 | 304 | 288 | 14 | 306 | 94 | 150 | 11 | 484 | 325 | 682 | 592 |
| 2020 | 110 | 1,200 | 1,028 | 1,073 | 758 | 448 | 928 | 619 | 930 | 594 | 403 | 76 |
| 2021 | 328 | 574 | 196 | 200 | 58 | 91 | 459 | 992 | 562 | -342 | -111 | 818 |
| 2022 | 553 | 200 | 516 | 208 | 155 | 229 | 384 | 3 | -149 | 596 | 334 | 849 |
| 2023 | 1,306 | 907 | 708 | 578 | 785 | 1,386 | 1,147 | 758 | 998 | 398 | 130 | 627 |
| 2024 | 154 | |||||||||||
| - = No Data Reported; -- = Not Applicable; NA = Not Available; W = Withheld to avoid disclosure of individual company data. |
| Release Date: 3/29/2024 |
| Next Release Date: 4/30/2024 |