|
Download Data (XLS File) |
|
||||||||
|
||||||||
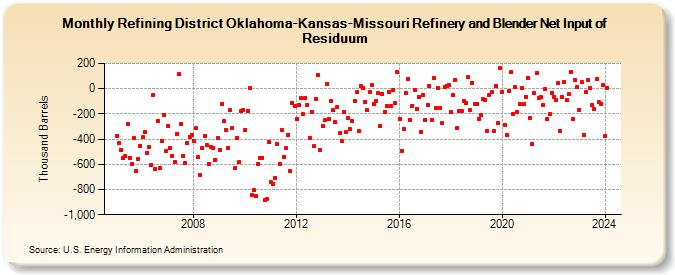
| Refining District Oklahoma-Kansas-Missouri Refinery and Blender Net Input of Residuum (Thousand Barrels) | ||||||||
| Year | Jan | Feb | Mar | Apr | May | Jun | Jul | Aug | Sep | Oct | Nov | Dec |
|---|---|---|---|---|---|---|---|---|---|---|---|---|
| 2005 | -378 | -430 | -484 | -547 | -536 | -280 | -549 | -597 | -389 | -653 | -560 | -451 |
| 2006 | -387 | -346 | -510 | -466 | -603 | -51 | -639 | -255 | -626 | -415 | -205 | -497 |
| 2007 | -295 | -469 | -534 | -580 | -358 | 115 | -280 | -531 | -593 | -428 | -381 | -366 |
| 2008 | -412 | -313 | -543 | -688 | -469 | -375 | -449 | -597 | -465 | -469 | -562 | -390 |
| 2009 | -487 | -119 | -260 | -326 | -471 | -170 | -313 | -632 | -393 | -582 | -181 | -172 |
| 2010 | -324 | -176 | 4 | -846 | -804 | -854 | -596 | -548 | -547 | -886 | -877 | -422 |
| 2011 | -744 | -755 | -708 | -441 | -599 | -325 | -542 | -473 | -365 | -655 | -114 | -139 |
| 2012 | -239 | -131 | -72 | -201 | -71 | -127 | -392 | -183 | -458 | -78 | 108 | -487 |
| 2013 | -295 | -251 | 39 | -244 | -99 | -172 | -266 | -143 | -353 | -419 | -183 | -343 |
| 2014 | -229 | -323 | -254 | -97 | -30 | -338 | 25 | 4 | -106 | -172 | -28 | 27 |
| 2015 | -120 | -97 | -36 | -293 | -39 | -182 | -138 | -23 | -140 | -8 | -117 | 132 |
| 2016 | -238 | -493 | -317 | -33 | 74 | -247 | -135 | -10 | -160 | -63 | -346 | -47 |
| 2017 | -248 | -131 | 18 | -245 | 83 | -151 | 9 | -151 | -276 | 10 | 25 | 27 |
| 2018 | -188 | -52 | 72 | -310 | -174 | -181 | -99 | -112 | 90 | -172 | 48 | -118 |
| 2019 | -121 | -237 | -212 | -85 | -91 | -339 | -54 | -30 | -338 | 19 | -276 | 168 |
| 2020 | -28 | -288 | -365 | -17 | 131 | -201 | 17 | -188 | -124 | 3 | -121 | -62 |
| 2021 | 87 | -230 | -440 | -31 | 126 | -76 | -67 | -127 | -1 | -243 | -204 | -31 |
| 2022 | -62 | -93 | 45 | -337 | -62 | 52 | -92 | -44 | 132 | -242 | 68 | 13 |
| 2023 | -170 | 57 | -366 | -23 | 68 | 3 | -133 | -159 | 77 | -106 | -118 | 30 |
| 2024 | -375 | |||||||||||
| - = No Data Reported; -- = Not Applicable; NA = Not Available; W = Withheld to avoid disclosure of individual company data. |
| Release Date: 3/29/2024 |
| Next Release Date: 4/30/2024 |