|
Download Data (XLS File) |
|
||||||||
|
||||||||
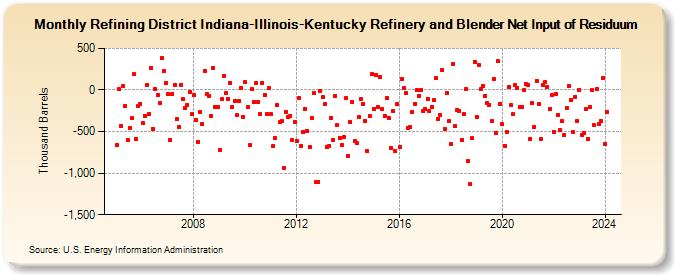
| Refining District Indiana-Illinois-Kentucky Refinery and Blender Net Input of Residuum (Thousand Barrels) | ||||||||
| Year | Jan | Feb | Mar | Apr | May | Jun | Jul | Aug | Sep | Oct | Nov | Dec |
|---|---|---|---|---|---|---|---|---|---|---|---|---|
| 2005 | -667 | 8 | -430 | 52 | -192 | -597 | -456 | -341 | 188 | -593 | -195 | -164 |
| 2006 | -400 | -308 | 61 | -286 | 270 | -466 | 6 | -61 | -152 | 385 | 225 | 89 |
| 2007 | -49 | -597 | -45 | 63 | -348 | -445 | 63 | -112 | -211 | -180 | -19 | -291 |
| 2008 | -61 | -360 | -620 | -263 | -410 | 234 | -48 | -69 | -307 | 265 | -200 | -203 |
| 2009 | -724 | -110 | 169 | -38 | -107 | 85 | -204 | -129 | -305 | -131 | 22 | -321 |
| 2010 | 98 | -208 | -662 | 17 | -142 | 89 | -145 | -292 | 87 | -59 | -293 | 21 |
| 2011 | -293 | -671 | -576 | -181 | -390 | -372 | -934 | -259 | -329 | -313 | -601 | -386 |
| 2012 | -611 | -95 | -668 | -501 | -228 | -489 | -683 | -337 | -42 | -1,106 | -1,101 | -10 |
| 2013 | -87 | -174 | -688 | -672 | -332 | -596 | -69 | -426 | -574 | -661 | -565 | -97 |
| 2014 | -793 | -384 | -142 | -613 | -640 | -328 | -114 | -169 | -369 | -735 | -317 | 198 |
| 2015 | -225 | 180 | -205 | 160 | -232 | -314 | -98 | -339 | -703 | -252 | -737 | -174 |
| 2016 | -688 | 136 | 19 | -35 | -457 | -449 | -261 | -166 | -2 | -73 | 1 | -257 |
| 2017 | -230 | -104 | -255 | -205 | -121 | 143 | -347 | -300 | 242 | -471 | -31 | -379 |
| 2018 | -645 | 315 | -435 | -240 | -254 | -599 | -292 | 6 | -859 | -1,133 | -580 | 341 |
| 2019 | -328 | 301 | 8 | 45 | -68 | -162 | -175 | -373 | 131 | -517 | 348 | -164 |
| 2020 | -415 | -669 | -511 | 38 | -185 | -292 | 54 | 25 | -206 | -209 | -4 | 70 |
| 2021 | 56 | -588 | -161 | -445 | 113 | -170 | -590 | 54 | 94 | 39 | -230 | -61 |
| 2022 | -501 | -47 | -300 | -479 | -376 | -542 | -221 | 50 | -123 | -506 | -81 | -371 |
| 2023 | 5 | -543 | -520 | -229 | -587 | -206 | -4 | -426 | 15 | -411 | -370 | 139 |
| 2024 | -646 | |||||||||||
| - = No Data Reported; -- = Not Applicable; NA = Not Available; W = Withheld to avoid disclosure of individual company data. |
| Release Date: 3/29/2024 |
| Next Release Date: 4/30/2024 |