|
Download Data (XLS File) |
|
||||||||
|
||||||||
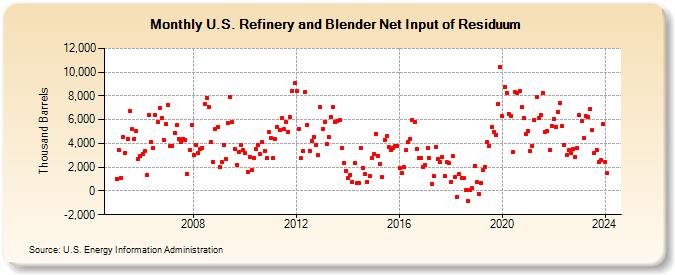
| U.S. Refinery and Blender Net Input of Residuum (Thousand Barrels) | ||||||||
| Year | Jan | Feb | Mar | Apr | May | Jun | Jul | Aug | Sep | Oct | Nov | Dec |
|---|---|---|---|---|---|---|---|---|---|---|---|---|
| 2005 | 1,031 | 3,435 | 1,118 | 4,529 | 3,189 | 4,352 | 6,700 | 5,202 | 4,412 | 5,011 | 2,696 | 2,983 |
| 2006 | 3,144 | 3,379 | 1,318 | 6,384 | 4,157 | 3,606 | 6,408 | 5,805 | 6,993 | 6,153 | 4,319 | 5,629 |
| 2007 | 7,268 | 3,756 | 3,796 | 4,886 | 5,521 | 4,371 | 4,094 | 4,403 | 4,262 | 1,449 | 3,451 | 5,526 |
| 2008 | 3,005 | 3,838 | 3,213 | 3,513 | 3,650 | 7,325 | 7,816 | 7,088 | 4,092 | 2,454 | 5,199 | 5,367 |
| 2009 | 2,003 | 2,408 | 3,910 | 2,669 | 5,697 | 7,918 | 5,795 | 3,551 | 2,213 | 3,317 | 3,863 | 3,431 |
| 2010 | 3,179 | 1,591 | 2,887 | 1,758 | 2,770 | 3,523 | 3,842 | 3,073 | 4,088 | 3,373 | 2,813 | 4,928 |
| 2011 | 4,457 | 2,797 | 4,386 | 5,424 | 5,170 | 6,108 | 5,178 | 5,770 | 5,002 | 6,197 | 8,435 | 9,074 |
| 2012 | 8,424 | 5,216 | 2,736 | 3,361 | 8,305 | 5,576 | 3,404 | 4,240 | 4,565 | 3,905 | 3,012 | 7,100 |
| 2013 | 5,218 | 5,796 | 3,965 | 4,534 | 6,241 | 7,059 | 5,772 | 5,893 | 5,962 | 3,629 | 2,360 | 1,700 |
| 2014 | 1,069 | 1,368 | 792 | 2,322 | 645 | 692 | 3,580 | 1,932 | 1,409 | 786 | 1,225 | 2,775 |
| 2015 | 3,101 | 4,825 | 2,976 | 2,286 | 1,161 | 4,298 | 4,634 | 3,733 | 3,436 | 3,636 | 3,824 | 3,791 |
| 2016 | 1,919 | 1,472 | 2,007 | 3,419 | 4,123 | 4,361 | 5,972 | 5,773 | 3,550 | 2,774 | 2,810 | 1,982 |
| 2017 | 2,167 | 3,587 | 2,739 | 564 | 1,260 | 3,711 | 2,670 | 2,405 | 2,842 | 1,238 | 2,396 | 2,316 |
| 2018 | 783 | 2,919 | 1,201 | -483 | 1,416 | 1,066 | 1,049 | 74 | -877 | 55 | 240 | 2,082 |
| 2019 | 717 | -226 | 644 | 1,759 | 2,058 | 4,124 | 3,785 | 5,342 | 4,965 | 4,679 | 7,301 | 10,431 |
| 2020 | 6,281 | 8,710 | 8,252 | 6,514 | 6,322 | 3,318 | 8,323 | 8,231 | 8,379 | 7,050 | 6,112 | 4,800 |
| 2021 | 5,024 | 3,335 | 3,811 | 5,934 | 7,901 | 6,118 | 6,414 | 8,250 | 4,991 | 5,070 | 3,438 | 5,481 |
| 2022 | 6,055 | 5,412 | 6,680 | 7,400 | 5,454 | 3,854 | 3,000 | 3,421 | 3,206 | 3,546 | 2,860 | 3,612 |
| 2023 | 6,370 | 5,865 | 4,460 | 6,331 | 6,198 | 6,863 | 5,130 | 3,229 | 3,450 | 2,401 | 2,609 | 5,623 |
| 2024 | 2,464 | |||||||||||
| - = No Data Reported; -- = Not Applicable; NA = Not Available; W = Withheld to avoid disclosure of individual company data. |
| Release Date: 3/29/2024 |
| Next Release Date: 4/30/2024 |