|
Download Data (XLS File) |
|
||||||||
|
||||||||
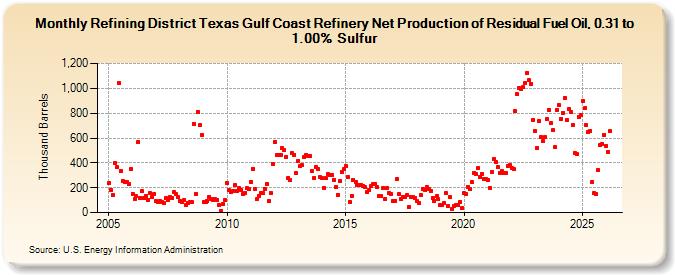
| Refining District Texas Gulf Coast Refinery Net Production of Residual Fuel Oil, 0.31 to 1.00% Sulfur (Thousand Barrels) | ||||||||
| Year | Jan | Feb | Mar | Apr | May | Jun | Jul | Aug | Sep | Oct | Nov | Dec |
|---|---|---|---|---|---|---|---|---|---|---|---|---|
| 2005 | 235 | 184 | 142 | 400 | 365 | 1,045 | 337 | 255 | 246 | 247 | 227 | 349 |
| 2006 | 153 | 106 | 133 | 570 | 120 | 172 | 115 | 134 | 104 | 156 | 129 | 150 |
| 2007 | 93 | 83 | 95 | 89 | 73 | 116 | 105 | 122 | 120 | 162 | 146 | 129 |
| 2008 | 93 | 86 | 99 | 60 | 80 | 83 | 83 | 715 | 149 | 812 | 701 | 626 |
| 2009 | 84 | 87 | 91 | 128 | 110 | 103 | 106 | 105 | 57 | 15 | 67 | 99 |
| 2010 | 234 | 178 | 166 | 177 | 221 | 177 | 198 | 180 | 148 | 156 | 195 | 187 |
| 2011 | 247 | 353 | 190 | 107 | 135 | 154 | 158 | 192 | 231 | 94 | 156 | 392 |
| 2012 | 570 | 464 | 460 | 467 | 518 | 500 | 449 | 279 | 261 | 477 | 464 | 316 |
| 2013 | 418 | 375 | 382 | 451 | 467 | 452 | 455 | 332 | 282 | 367 | 353 | 284 |
| 2014 | 277 | 201 | 278 | 312 | 300 | 306 | 266 | 207 | 144 | 253 | 327 | 347 |
| 2015 | 377 | 287 | 85 | 137 | 265 | 248 | 222 | 220 | 225 | 215 | 205 | 162 |
| 2016 | 184 | 215 | 227 | 231 | 205 | 130 | 130 | 196 | 110 | 197 | 157 | 151 |
| 2017 | 97 | 96 | 272 | 147 | 111 | 129 | 123 | 140 | 45 | 128 | 125 | 116 |
| 2018 | 90 | 78 | 141 | 193 | 180 | 204 | 190 | 174 | 118 | 97 | 132 | 106 |
| 2019 | 61 | 63 | 75 | 154 | 52 | 124 | 30 | 53 | 64 | 61 | 85 | 38 |
| 2020 | 157 | 149 | 209 | 186 | 243 | 322 | 312 | 360 | 284 | 313 | 273 | 268 |
| 2021 | 264 | 198 | 323 | 433 | 410 | 369 | 321 | 333 | 315 | 316 | 375 | 381 |
| 2022 | 359 | 348 | 814 | 951 | 1,001 | 998 | 1,008 | 1,043 | 1,124 | 1,064 | 1,037 | 747 |
| 2023 | 658 | 519 | 733 | 607 | 578 | 606 | 753 | 829 | 722 | 661 | 527 | 829 |
| 2024 | 867 | |||||||||||
| - = No Data Reported; -- = Not Applicable; NA = Not Available; W = Withheld to avoid disclosure of individual company data. |
| Release Date: 3/29/2024 |
| Next Release Date: 4/30/2024 |