|
Download Data (XLS File) |
|
||||||||
|
||||||||
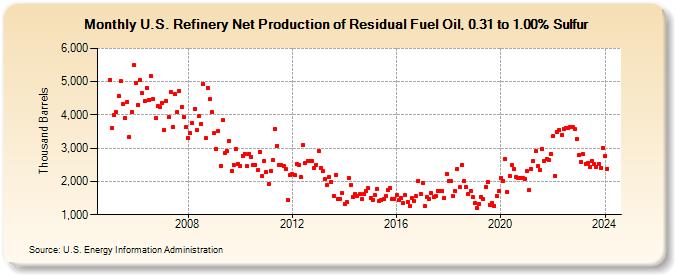
| U.S. Refinery Net Production of Residual Fuel Oil, 0.31 to 1.00% Sulfur (Thousand Barrels) | ||||||||
| Year | Jan | Feb | Mar | Apr | May | Jun | Jul | Aug | Sep | Oct | Nov | Dec |
|---|---|---|---|---|---|---|---|---|---|---|---|---|
| 2005 | 5,051 | 3,607 | 4,001 | 4,086 | 4,566 | 5,005 | 4,317 | 3,893 | 4,391 | 3,345 | 4,093 | 5,488 |
| 2006 | 4,948 | 4,300 | 5,055 | 4,646 | 4,424 | 4,823 | 4,450 | 5,157 | 4,464 | 3,895 | 4,254 | 4,232 |
| 2007 | 4,370 | 3,540 | 4,424 | 3,923 | 4,695 | 3,625 | 4,615 | 4,084 | 4,720 | 4,248 | 3,939 | 3,626 |
| 2008 | 3,308 | 3,449 | 3,753 | 4,189 | 3,536 | 3,962 | 3,734 | 4,925 | 3,295 | 4,819 | 4,471 | 4,083 |
| 2009 | 3,445 | 2,974 | 3,516 | 2,464 | 3,835 | 2,852 | 2,901 | 3,216 | 2,308 | 2,496 | 2,979 | 2,538 |
| 2010 | 2,479 | 2,778 | 2,833 | 2,458 | 2,838 | 2,735 | 2,500 | 2,494 | 2,338 | 2,897 | 2,163 | 2,600 |
| 2011 | 2,282 | 1,931 | 2,322 | 2,634 | 3,579 | 3,066 | 2,494 | 2,486 | 2,457 | 2,372 | 1,440 | 2,182 |
| 2012 | 2,229 | 2,179 | 2,529 | 2,501 | 2,120 | 3,103 | 2,558 | 2,627 | 2,624 | 2,620 | 2,403 | 2,487 |
| 2013 | 2,924 | 2,413 | 2,302 | 2,063 | 1,880 | 2,127 | 1,988 | 1,565 | 2,202 | 1,479 | 1,482 | 1,651 |
| 2014 | 1,319 | 1,386 | 2,103 | 1,902 | 1,539 | 1,626 | 1,556 | 1,614 | 1,460 | 1,626 | 1,726 | 1,795 |
| 2015 | 1,516 | 1,455 | 1,580 | 1,776 | 1,412 | 1,432 | 1,477 | 1,558 | 1,742 | 1,796 | 1,481 | 1,486 |
| 2016 | 1,597 | 1,429 | 1,495 | 1,341 | 1,594 | 1,386 | 1,276 | 1,488 | 1,408 | 1,553 | 2,028 | 1,625 |
| 2017 | 1,958 | 1,253 | 1,540 | 1,483 | 1,639 | 1,527 | 1,574 | 1,725 | 1,720 | 1,710 | 1,492 | 2,234 |
| 2018 | 2,017 | 2,003 | 1,558 | 1,723 | 2,367 | 1,819 | 2,508 | 2,013 | 1,847 | 1,615 | 1,712 | 1,524 |
| 2019 | 1,347 | 1,191 | 1,327 | 1,535 | 1,466 | 1,835 | 1,982 | 1,306 | 1,360 | 1,255 | 1,559 | 1,698 |
| 2020 | 2,107 | 2,026 | 2,681 | 1,683 | 2,178 | 2,487 | 2,382 | 2,130 | 2,089 | 2,117 | 2,117 | 2,084 |
| 2021 | 2,301 | 1,749 | 2,378 | 2,624 | 2,903 | 2,459 | 2,358 | 2,980 | 2,625 | 2,670 | 2,653 | 2,840 |
| 2022 | 3,355 | 2,164 | 3,500 | 3,553 | 3,399 | 3,584 | 3,617 | 3,610 | 3,625 | 3,631 | 3,565 | 3,290 |
| 2023 | 2,803 | 2,587 | 2,816 | 2,535 | 2,547 | 2,437 | 2,627 | 2,519 | 2,437 | 2,535 | 2,410 | 3,010 |
| 2024 | 2,758 | |||||||||||
| - = No Data Reported; -- = Not Applicable; NA = Not Available; W = Withheld to avoid disclosure of individual company data. |
| Release Date: 3/29/2024 |
| Next Release Date: 4/30/2024 |