|
Download Data (XLS File) |
|
||||||||
|
||||||||
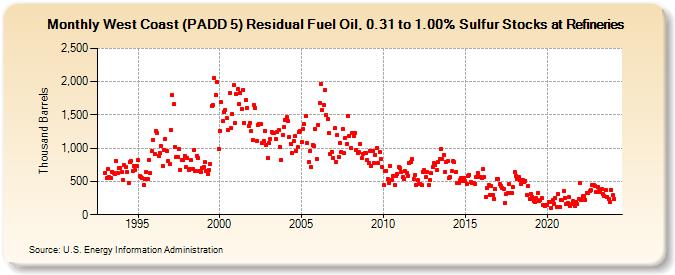
| West Coast (PADD 5) Residual Fuel Oil, 0.31 to 1.00% Sulfur Stocks at Refineries (Thousand Barrels) | ||||||||
| Year | Jan | Feb | Mar | Apr | May | Jun | Jul | Aug | Sep | Oct | Nov | Dec |
|---|---|---|---|---|---|---|---|---|---|---|---|---|
| 1993 | 630 | 545 | 680 | 563 | 548 | 648 | 628 | 614 | 813 | 623 | 708 | 709 |
| 1994 | 635 | 515 | 742 | 718 | 639 | 484 | 787 | 810 | 660 | 739 | 669 | 731 |
| 1995 | 821 | 575 | 561 | 550 | 452 | 544 | 641 | 543 | 823 | 630 | 956 | 1,129 |
| 1996 | 915 | 1,260 | 1,231 | 881 | 924 | 1,034 | 739 | 977 | 1,142 | 958 | 810 | 755 |
| 1997 | 1,272 | 1,792 | 1,658 | 1,021 | 874 | 867 | 982 | 678 | 820 | 824 | 888 | 715 |
| 1998 | 855 | 674 | 688 | 815 | 687 | 969 | 659 | 885 | 849 | 662 | 649 | 705 |
| 1999 | 721 | 786 | 663 | 614 | 675 | 758 | 1,635 | 1,648 | 2,052 | 1,799 | 1,990 | 993 |
| 2000 | 1,256 | 1,691 | 1,404 | 1,551 | 1,577 | 1,450 | 1,275 | 1,828 | 1,299 | 1,517 | 1,949 | 1,378 |
| 2001 | 1,812 | 1,887 | 1,662 | 1,829 | 1,594 | 1,880 | 1,385 | 1,722 | 1,604 | 1,340 | 1,380 | 1,260 |
| 2002 | 1,117 | 1,651 | 1,601 | 1,102 | 1,353 | 1,361 | 1,360 | 1,074 | 1,108 | 1,258 | 1,042 | 849 |
| 2003 | 1,073 | 1,140 | 1,237 | 1,232 | 1,235 | 1,139 | 1,237 | 1,267 | 1,019 | 827 | 1,202 | 1,315 |
| 2004 | 1,418 | 1,462 | 1,402 | 1,171 | 1,070 | 929 | 1,103 | 1,179 | 956 | 1,011 | 1,239 | 1,265 |
| 2005 | 1,088 | 1,295 | 1,359 | 1,484 | 1,082 | 792 | 956 | 713 | 1,055 | 1,035 | 1,285 | 842 |
| 2006 | 1,355 | 1,675 | 1,970 | 1,578 | 1,651 | 1,875 | 1,493 | 1,434 | 1,224 | 920 | 946 | 859 |
| 2007 | 1,299 | 798 | 1,203 | 864 | 1,078 | 950 | 1,289 | 925 | 1,158 | 1,061 | 1,479 | 1,183 |
| 2008 | 1,002 | 1,234 | 1,189 | 1,232 | 980 | 925 | 937 | 1,070 | 847 | 917 | 928 | 928 |
| 2009 | 824 | 771 | 964 | 729 | 954 | 773 | 899 | 1,005 | 776 | 939 | 834 | 712 |
| 2010 | 445 | 661 | 663 | 530 | 484 | 733 | 529 | 585 | 444 | 581 | 615 | 720 |
| 2011 | 695 | 636 | 564 | 538 | 651 | 634 | 586 | 778 | 798 | 833 | 532 | 595 |
| 2012 | 443 | 518 | 457 | 468 | 442 | 644 | 668 | 570 | 640 | 444 | 520 | 621 |
| 2013 | 724 | 777 | 743 | 671 | 796 | 836 | 990 | 837 | 904 | 647 | 795 | 800 |
| 2014 | 550 | 561 | 650 | 811 | 788 | 645 | 483 | 483 | 518 | 546 | 504 | 551 |
| 2015 | 504 | 464 | 582 | 602 | 491 | 479 | 473 | 468 | 563 | 634 | 564 | 573 |
| 2016 | 549 | 690 | 560 | 270 | 405 | 441 | 298 | 435 | 299 | 242 | 385 | 536 |
| 2017 | 532 | 460 | 433 | 406 | 382 | 179 | 314 | 325 | 460 | 330 | 330 | 413 |
| 2018 | 636 | 582 | 531 | 569 | 524 | 461 | 526 | 499 | 512 | 298 | 435 | 239 |
| 2019 | 317 | 271 | 211 | 187 | 244 | 331 | 199 | 228 | 246 | 146 | 129 | 144 |
| 2020 | 152 | 192 | 195 | 107 | 221 | 167 | 254 | 123 | 313 | 122 | 227 | 224 |
| 2021 | 357 | 256 | 163 | 181 | 261 | 130 | 168 | 199 | 135 | 186 | 154 | 241 |
| 2022 | 473 | 226 | 276 | 274 | 222 | 333 | 326 | 351 | 378 | 452 | 454 | 430 |
| 2023 | 344 | 415 | 350 | 347 | 383 | 308 | 277 | 365 | 266 | 232 | 197 | 378 |
| 2024 | 289 | |||||||||||
| - = No Data Reported; -- = Not Applicable; NA = Not Available; W = Withheld to avoid disclosure of individual company data. |
| Release Date: 3/29/2024 |
| Next Release Date: 4/30/2024 |