|
Download Data (XLS File) |
|
||||||||
|
||||||||
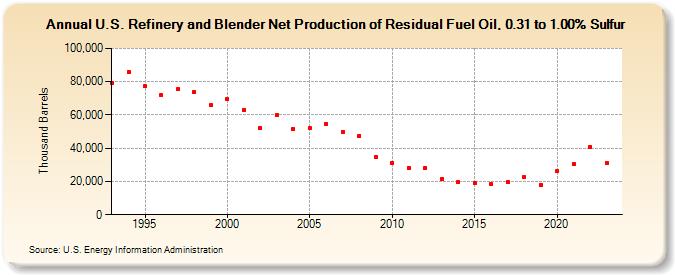
| U.S. Refinery and Blender Net Production of Residual Fuel Oil, 0.31 to 1.00% Sulfur (Thousand Barrels) | ||||||||
| Decade | Year-0 | Year-1 | Year-2 | Year-3 | Year-4 | Year-5 | Year-6 | Year-7 | Year-8 | Year-9 |
|---|---|---|---|---|---|---|---|---|---|---|
| 1990's | 79,127 | 85,836 | 77,228 | 71,824 | 75,334 | 73,657 | 65,925 | |||
| 2000's | 69,376 | 63,061 | 52,104 | 59,834 | 51,422 | 51,843 | 54,648 | 49,809 | 47,524 | 34,982 |
| 2010's | 31,190 | 28,264 | 28,109 | 21,498 | 19,538 | 19,038 | 18,212 | 19,577 | 22,667 | 17,865 |
| 2020's | 26,058 | 30,548 | 40,777 | 31,224 |
| - = No Data Reported; -- = Not Applicable; NA = Not Available; W = Withheld to avoid disclosure of individual company data. |
| Release Date: 3/29/2024 |
| Next Release Date: 8/30/2024 |