|
Download Data (XLS File) |
|
||||||||
|
||||||||
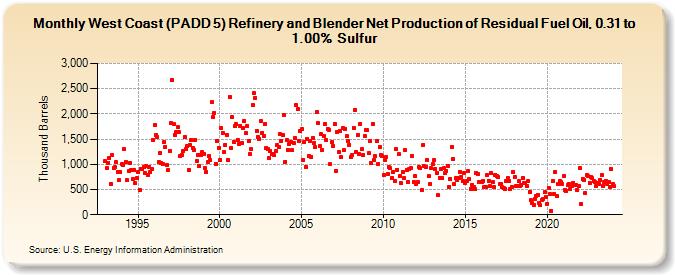
| West Coast (PADD 5) Refinery and Blender Net Production of Residual Fuel Oil, 0.31 to 1.00% Sulfur (Thousand Barrels) | ||||||||
| Year | Jan | Feb | Mar | Apr | May | Jun | Jul | Aug | Sep | Oct | Nov | Dec |
|---|---|---|---|---|---|---|---|---|---|---|---|---|
| 1993 | 1,058 | 924 | 1,031 | 1,120 | 619 | 1,178 | 926 | 938 | 1,039 | 857 | 686 | 847 |
| 1994 | 1,005 | 993 | 1,298 | 1,052 | 683 | 862 | 1,026 | 880 | 706 | 884 | 624 | 721 |
| 1995 | 838 | 494 | 915 | 912 | 943 | 834 | 959 | 785 | 955 | 839 | 900 | 1,488 |
| 1996 | 1,778 | 1,591 | 1,551 | 1,047 | 1,226 | 1,021 | 1,009 | 1,437 | 1,349 | 990 | 887 | 1,272 |
| 1997 | 1,819 | 2,676 | 1,809 | 1,584 | 1,636 | 1,732 | 1,633 | 1,160 | 1,185 | 1,261 | 1,542 | 1,305 |
| 1998 | 1,359 | 895 | 1,385 | 1,482 | 1,329 | 1,290 | 1,487 | 1,069 | 1,192 | 964 | 1,192 | 1,238 |
| 1999 | 1,207 | 924 | 838 | 1,046 | 1,169 | 1,090 | 2,228 | 1,937 | 2,018 | 1,014 | 1,472 | 1,327 |
| 2000 | 1,084 | 1,722 | 1,620 | 1,249 | 1,388 | 1,588 | 1,084 | 2,343 | 1,322 | 1,946 | 1,449 | 1,750 |
| 2001 | 1,792 | 1,488 | 1,399 | 1,760 | 1,419 | 1,715 | 1,860 | 1,613 | 1,762 | 1,458 | 1,200 | 1,295 |
| 2002 | 2,169 | 2,408 | 2,322 | 1,665 | 1,548 | 1,501 | 1,850 | 1,629 | 1,558 | 1,795 | 1,328 | 1,308 |
| 2003 | 1,133 | 1,255 | 1,199 | 1,212 | 1,175 | 1,254 | 1,383 | 1,348 | 1,596 | 1,462 | 1,583 | 1,975 |
| 2004 | 1,053 | 1,476 | 1,288 | 1,412 | 1,447 | 1,275 | 1,432 | 1,516 | 2,181 | 2,089 | 1,453 | 1,654 |
| 2005 | 1,702 | 1,095 | 1,444 | 948 | 1,498 | 1,156 | 1,462 | 1,152 | 1,526 | 1,426 | 1,341 | 2,033 |
| 2006 | 1,818 | 1,361 | 1,594 | 1,289 | 1,569 | 1,790 | 1,475 | 1,702 | 1,689 | 999 | 1,436 | 1,366 |
| 2007 | 1,800 | 875 | 1,646 | 1,248 | 1,659 | 1,140 | 1,719 | 1,282 | 1,707 | 1,553 | 1,457 | 1,383 |
| 2008 | 1,148 | 1,187 | 1,726 | 2,075 | 1,246 | 1,584 | 1,210 | 1,801 | 1,297 | 1,188 | 1,554 | 1,683 |
| 2009 | 1,673 | 1,219 | 1,469 | 1,016 | 1,805 | 1,082 | 1,162 | 1,464 | 1,012 | 1,351 | 1,187 | 1,164 |
| 2010 | 789 | 1,093 | 1,145 | 815 | 942 | 918 | 729 | 842 | 677 | 1,302 | 894 | 1,195 |
| 2011 | 776 | 622 | 853 | 722 | 1,275 | 888 | 648 | 903 | 929 | 1,159 | 644 | 766 |
| 2012 | 617 | 645 | 943 | 921 | 489 | 1,388 | 968 | 952 | 1,088 | 759 | 607 | 923 |
| 2013 | 1,000 | 1,082 | 908 | 825 | 382 | 734 | 904 | 724 | 918 | 818 | 867 | 976 |
| 2014 | 558 | 709 | 1,352 | 1,103 | 609 | 723 | 695 | 719 | 849 | 757 | 669 | 837 |
| 2015 | 622 | 672 | 860 | 710 | 515 | 596 | 546 | 502 | 832 | 811 | 654 | 650 |
| 2016 | 655 | 670 | 544 | 544 | 790 | 678 | 567 | 826 | 642 | 548 | 793 | 760 |
| 2017 | 753 | 614 | 617 | 541 | 527 | 520 | 666 | 724 | 665 | 518 | 556 | 844 |
| 2018 | 749 | 575 | 570 | 664 | 576 | 581 | 736 | 625 | 637 | 572 | 664 | 458 |
| 2019 | 282 | 224 | 190 | 312 | 380 | 395 | 225 | 187 | 285 | 305 | 446 | 353 |
| 2020 | 218 | 536 | 407 | 77 | 667 | 415 | 849 | 371 | 603 | 661 | 641 | 608 |
| 2021 | 766 | 497 | 472 | 591 | 618 | 520 | 578 | 633 | 580 | 585 | 493 | 572 |
| 2022 | 918 | 215 | 713 | 694 | 427 | 786 | 765 | 635 | 757 | 727 | 671 | 647 |
| 2023 | 571 | 626 | 614 | 697 | 783 | 565 | 657 | 676 | 608 | 654 | 558 | 904 |
| 2024 | 618 | |||||||||||
| - = No Data Reported; -- = Not Applicable; NA = Not Available; W = Withheld to avoid disclosure of individual company data. |
| Release Date: 3/29/2024 |
| Next Release Date: 4/30/2024 |