|
Download Data (XLS File) |
|
||||||||
|
||||||||
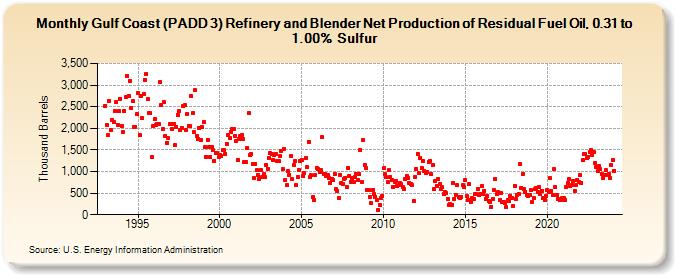
| Gulf Coast (PADD 3) Refinery and Blender Net Production of Residual Fuel Oil, 0.31 to 1.00% Sulfur (Thousand Barrels) | ||||||||
| Year | Jan | Feb | Mar | Apr | May | Jun | Jul | Aug | Sep | Oct | Nov | Dec |
|---|---|---|---|---|---|---|---|---|---|---|---|---|
| 1993 | 2,523 | 2,086 | 1,845 | 2,637 | 1,972 | 2,196 | 2,144 | 2,411 | 2,600 | 2,082 | 2,393 | 2,684 |
| 1994 | 2,056 | 1,914 | 2,410 | 2,717 | 3,220 | 2,745 | 3,106 | 2,479 | 2,621 | 2,034 | 2,038 | 2,326 |
| 1995 | 2,816 | 1,840 | 2,743 | 2,235 | 2,804 | 3,127 | 3,266 | 2,675 | 2,360 | 2,344 | 1,339 | 2,044 |
| 1996 | 2,206 | 2,079 | 2,093 | 2,098 | 3,080 | 2,532 | 1,973 | 2,602 | 1,830 | 1,671 | 1,773 | 2,105 |
| 1997 | 2,096 | 1,977 | 2,110 | 1,612 | 2,041 | 2,314 | 2,389 | 1,962 | 2,016 | 2,521 | 2,528 | 1,969 |
| 1998 | 2,333 | 2,057 | 2,046 | 2,737 | 2,351 | 1,918 | 2,876 | 1,829 | 1,760 | 2,018 | 1,722 | 2,039 |
| 1999 | 2,138 | 1,563 | 1,342 | 1,730 | 1,557 | 1,335 | 1,568 | 1,493 | 1,254 | 1,436 | 1,427 | 1,325 |
| 2000 | 1,385 | 1,350 | 1,488 | 1,493 | 1,415 | 1,644 | 1,844 | 1,779 | 1,903 | 1,995 | 1,975 | 1,832 |
| 2001 | 1,704 | 1,276 | 1,744 | 1,826 | 1,840 | 1,753 | 1,215 | 1,222 | 1,549 | 2,350 | 1,374 | 1,406 |
| 2002 | 1,166 | 844 | 1,182 | 1,032 | 922 | 825 | 1,033 | 872 | 934 | 863 | 1,146 | 1,065 |
| 2003 | 1,311 | 1,417 | 1,415 | 1,261 | 1,375 | 1,405 | 1,254 | 1,234 | 1,369 | 1,479 | 1,047 | 1,522 |
| 2004 | 803 | 681 | 1,003 | 924 | 1,367 | 816 | 1,147 | 1,232 | 678 | 875 | 1,032 | 1,252 |
| 2005 | 1,261 | 891 | 959 | 1,315 | 1,096 | 1,691 | 865 | 910 | 404 | 339 | 918 | 1,084 |
| 2006 | 1,057 | 985 | 1,024 | 1,798 | 949 | 951 | 889 | 914 | 844 | 742 | 835 | 793 |
| 2007 | 944 | 587 | 546 | 390 | 920 | 736 | 713 | 834 | 846 | 650 | 1,083 | 902 |
| 2008 | 763 | 855 | 762 | 865 | 934 | 799 | 940 | 1,497 | 764 | 1,732 | 1,153 | 1,072 |
| 2009 | 572 | 571 | 412 | 264 | 575 | 477 | 421 | 332 | 101 | 234 | 396 | 441 |
| 2010 | 1,074 | 935 | 862 | 749 | 1,028 | 873 | 795 | 651 | 761 | 790 | 656 | 679 |
| 2011 | 728 | 703 | 651 | 592 | 823 | 900 | 861 | 734 | 700 | 685 | 326 | 875 |
| 2012 | 1,065 | 1,415 | 958 | 1,313 | 1,089 | 1,233 | 1,004 | 965 | 997 | 1,224 | 1,246 | 943 |
| 2013 | 1,144 | 587 | 787 | 673 | 832 | 704 | 593 | 632 | 476 | 515 | 500 | 374 |
| 2014 | 224 | 240 | 235 | 730 | 374 | 455 | 677 | 411 | 384 | 412 | 679 | 639 |
| 2015 | 797 | 432 | 352 | 706 | 287 | 376 | 354 | 487 | 468 | 596 | 445 | 471 |
| 2016 | 659 | 487 | 558 | 367 | 436 | 323 | 303 | 190 | 356 | 564 | 838 | 468 |
| 2017 | 517 | 335 | 497 | 292 | 292 | 266 | 169 | 346 | 319 | 441 | 394 | 205 |
| 2018 | 675 | 370 | 462 | 477 | 1,170 | 625 | 949 | 587 | 532 | 449 | 439 | 464 |
| 2019 | 565 | 291 | 389 | 589 | 623 | 517 | 643 | 482 | 556 | 395 | 347 | 443 |
| 2020 | 577 | 520 | 843 | 559 | 456 | 1,047 | 632 | 452 | 370 | 341 | 348 | 395 |
| 2021 | 385 | 347 | 630 | 731 | 830 | 653 | 687 | 771 | 556 | 679 | 806 | 767 |
| 2022 | 913 | 737 | 1,264 | 1,396 | 1,400 | 1,311 | 1,346 | 1,446 | 1,488 | 1,390 | 1,445 | 1,208 |
| 2023 | 1,101 | 1,003 | 1,120 | 1,048 | 952 | 854 | 921 | 1,026 | 921 | 936 | 856 | 1,159 |
| 2024 | 1,272 | 1,018 | 1,096 | 1,293 | 1,152 | 1,164 | ||||||
| - = No Data Reported; -- = Not Applicable; NA = Not Available; W = Withheld to avoid disclosure of individual company data. |
| Release Date: 8/30/2024 |
| Next Release Date: 9/30/2024 |