|
Download Data (XLS File) |
|
||||||||
|
||||||||
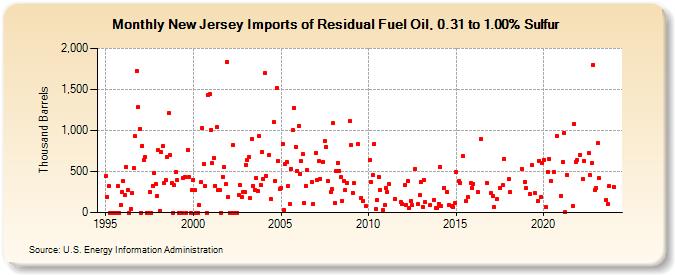
| New Jersey Imports of Residual Fuel Oil, 0.31 to 1.00% Sulfur (Thousand Barrels) | ||||||||
| Year | Jan | Feb | Mar | Apr | May | Jun | Jul | Aug | Sep | Oct | Nov | Dec |
|---|---|---|---|---|---|---|---|---|---|---|---|---|
| 1995 | 444 | 195 | 319 | 0 | 0 | 0 | 0 | 0 | 325 | 0 | 95 | 248 |
| 1996 | 379 | 215 | 555 | 272 | 0 | 48 | 240 | 541 | 929 | 1,727 | 1,280 | 1,023 |
| 1997 | 0 | 815 | 640 | 671 | 0 | 0 | 255 | 0 | 324 | 483 | 342 | 207 |
| 1998 | 757 | 19 | 736 | 807 | 358 | 396 | 672 | 1,208 | 703 | 357 | 0 | 331 |
| 1999 | 494 | 395 | 0 | 0 | 0 | 427 | 431 | 0 | 761 | 438 | 0 | 270 |
| 2000 | 401 | 272 | 0 | 0 | 89 | 368 | 1,032 | 591 | 321 | 0 | 1,430 | 1,441 |
| 2001 | 1,004 | 603 | 667 | 327 | 1,042 | 269 | 277 | 0 | 438 | 551 | 343 | 1,835 |
| 2002 | 185 | 0 | 0 | 822 | 0 | 0 | 0 | 214 | 333 | 187 | 245 | 251 |
| 2003 | 585 | 639 | 680 | 172 | 900 | 324 | 280 | 425 | 257 | 931 | 340 | 738 |
| 2004 | 407 | 1,700 | 449 | 702 | 162 | 1,104 | 384 | 1,523 | 629 | 284 | ||
| 2005 | 297 | 835 | 32 | 588 | 614 | 324 | 101 | 531 | 1,002 | 1,278 | 801 | 505 |
| 2006 | 1,053 | 469 | 630 | 711 | 119 | 327 | 515 | 375 | 107 | |||
| 2007 | 729 | 392 | 623 | 413 | 617 | 869 | 800 | 382 | 247 | 282 | ||
| 2008 | 1,085 | 119 | 501 | 607 | 511 | 429 | 145 | 386 | 274 | 356 | 1,113 | |
| 2009 | 820 | 241 | 355 | 831 | 183 | 145 | 77 | |||||
| 2010 | 643 | 374 | 457 | 837 | 45 | 155 | 438 | 276 | 30 | 90 | ||
| 2011 | 297 | 253 | 347 | 163 | 128 | 110 | ||||||
| 2012 | 335 | 95 | 387 | 58 | 143 | 91 | 531 | 104 | 213 | |||
| 2013 | 367 | 70 | 398 | 123 | 89 | 158 | 50 | 58 | ||||
| 2014 | 109 | 557 | 77 | 300 | 251 | 91 | 74 | 73 | 119 | |||
| 2015 | 496 | 382 | 366 | 684 | 140 | 184 | 358 | 304 | ||||
| 2016 | 352 | 250 | 896 | 366 | ||||||||
| 2017 | 236 | 200 | 68 | 165 | 300 | 332 | 653 | |||||
| 2018 | 406 | 253 | 535 | 375 | ||||||||
| 2019 | 297 | 226 | 579 | 240 | 136 | 632 | 188 | 602 | ||||
| 2020 | 642 | 67 | 496 | 658 | 381 | 497 | 938 | |||||
| 2021 | 205 | 613 | 973 | 2 | 458 | 75 | 1,082 | 618 | 636 | |||
| 2022 | 706 | 408 | 630 | 724 | 456 | 602 | 1,802 | 272 | ||||
| 2023 | 298 | 847 | 417 | 159 | 100 | 323 | ||||||
| 2024 | 314 | |||||||||||
| - = No Data Reported; -- = Not Applicable; NA = Not Available; W = Withheld to avoid disclosure of individual company data. |
| Release Date: 3/29/2024 |
| Next Release Date: 4/30/2024 |